Dutch West Indian vs Ottawa College, Under 1 year
COMPARE
Dutch West Indian
Ottawa
College, Under 1 year
College, Under 1 year Comparison
Dutch West Indians
Ottawa
57.2%
COLLEGE, UNDER 1 YEAR
0.0/ 100
METRIC RATING
313th/ 347
METRIC RANK
62.2%
COLLEGE, UNDER 1 YEAR
1.1/ 100
METRIC RATING
241st/ 347
METRIC RANK
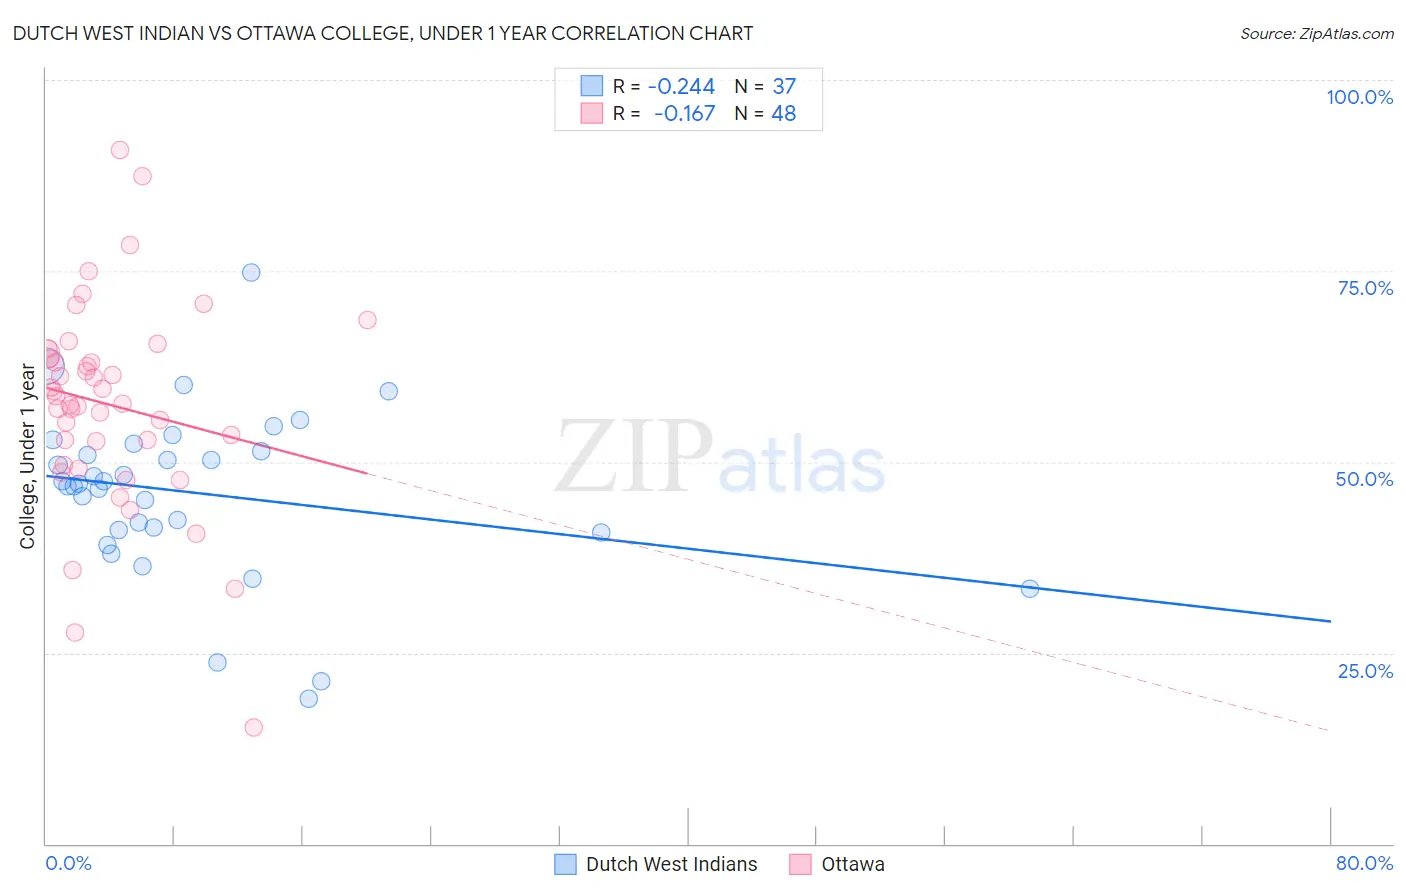
Dutch West Indian vs Ottawa College, Under 1 year Correlation Chart
The statistical analysis conducted on geographies consisting of 85,776,067 people shows a weak negative correlation between the proportion of Dutch West Indians and percentage of population with at least college, under 1 year education in the United States with a correlation coefficient (R) of -0.244 and weighted average of 57.2%. Similarly, the statistical analysis conducted on geographies consisting of 49,956,726 people shows a poor negative correlation between the proportion of Ottawa and percentage of population with at least college, under 1 year education in the United States with a correlation coefficient (R) of -0.167 and weighted average of 62.2%, a difference of 8.8%.
College, Under 1 year Correlation Summary
| Measurement | Dutch West Indian | Ottawa |
| Minimum | 19.0% | 15.3% |
| Maximum | 74.8% | 90.8% |
| Range | 55.8% | 75.6% |
| Mean | 45.9% | 57.5% |
| Median | 47.1% | 58.1% |
| Interquartile 25% (IQ1) | 40.9% | 51.2% |
| Interquartile 75% (IQ3) | 51.9% | 63.8% |
| Interquartile Range (IQR) | 11.1% | 12.6% |
| Standard Deviation (Sample) | 11.0% | 13.6% |
| Standard Deviation (Population) | 10.8% | 13.5% |
Similar Demographics by College, Under 1 year
Demographics Similar to Dutch West Indians by College, Under 1 year
In terms of college, under 1 year, the demographic groups most similar to Dutch West Indians are Hopi (57.1%, a difference of 0.12%), Honduran (57.1%, a difference of 0.16%), Menominee (57.0%, a difference of 0.22%), Salvadoran (57.3%, a difference of 0.24%), and Hispanic or Latino (57.0%, a difference of 0.26%).
| Demographics | Rating | Rank | College, Under 1 year |
| Immigrants | Portugal | 0.0 /100 | #306 | Tragic 57.7% |
| Fijians | 0.0 /100 | #307 | Tragic 57.7% |
| Central Americans | 0.0 /100 | #308 | Tragic 57.7% |
| Immigrants | Nicaragua | 0.0 /100 | #309 | Tragic 57.6% |
| Pueblo | 0.0 /100 | #310 | Tragic 57.4% |
| Cajuns | 0.0 /100 | #311 | Tragic 57.3% |
| Salvadorans | 0.0 /100 | #312 | Tragic 57.3% |
| Dutch West Indians | 0.0 /100 | #313 | Tragic 57.2% |
| Hopi | 0.0 /100 | #314 | Tragic 57.1% |
| Hondurans | 0.0 /100 | #315 | Tragic 57.1% |
| Menominee | 0.0 /100 | #316 | Tragic 57.0% |
| Hispanics or Latinos | 0.0 /100 | #317 | Tragic 57.0% |
| Immigrants | Haiti | 0.0 /100 | #318 | Tragic 56.9% |
| Puerto Ricans | 0.0 /100 | #319 | Tragic 56.8% |
| Guatemalans | 0.0 /100 | #320 | Tragic 56.8% |
Demographics Similar to Ottawa by College, Under 1 year
In terms of college, under 1 year, the demographic groups most similar to Ottawa are Nepalese (62.2%, a difference of 0.010%), Aleut (62.2%, a difference of 0.010%), Malaysian (62.2%, a difference of 0.050%), Hawaiian (62.1%, a difference of 0.080%), and Colville (62.1%, a difference of 0.17%).
| Demographics | Rating | Rank | College, Under 1 year |
| Chippewa | 2.0 /100 | #234 | Tragic 62.6% |
| Spanish Americans | 1.9 /100 | #235 | Tragic 62.6% |
| Immigrants | Immigrants | 1.7 /100 | #236 | Tragic 62.5% |
| Immigrants | Burma/Myanmar | 1.6 /100 | #237 | Tragic 62.5% |
| French American Indians | 1.5 /100 | #238 | Tragic 62.4% |
| Nepalese | 1.1 /100 | #239 | Tragic 62.2% |
| Aleuts | 1.1 /100 | #240 | Tragic 62.2% |
| Ottawa | 1.1 /100 | #241 | Tragic 62.2% |
| Malaysians | 1.1 /100 | #242 | Tragic 62.2% |
| Hawaiians | 1.1 /100 | #243 | Tragic 62.1% |
| Colville | 1.0 /100 | #244 | Tragic 62.1% |
| Delaware | 0.9 /100 | #245 | Tragic 62.1% |
| Marshallese | 0.8 /100 | #246 | Tragic 61.9% |
| Immigrants | Liberia | 0.8 /100 | #247 | Tragic 61.9% |
| Potawatomi | 0.6 /100 | #248 | Tragic 61.8% |