Puget Sound Salish vs Nonimmigrants College, Under 1 year
COMPARE
Puget Sound Salish
Nonimmigrants
College, Under 1 year
College, Under 1 year Comparison
Puget Sound Salish
Nonimmigrants
63.9%
COLLEGE, UNDER 1 YEAR
11.3/ 100
METRIC RATING
209th/ 347
METRIC RANK
62.9%
COLLEGE, UNDER 1 YEAR
3.0/ 100
METRIC RATING
230th/ 347
METRIC RANK
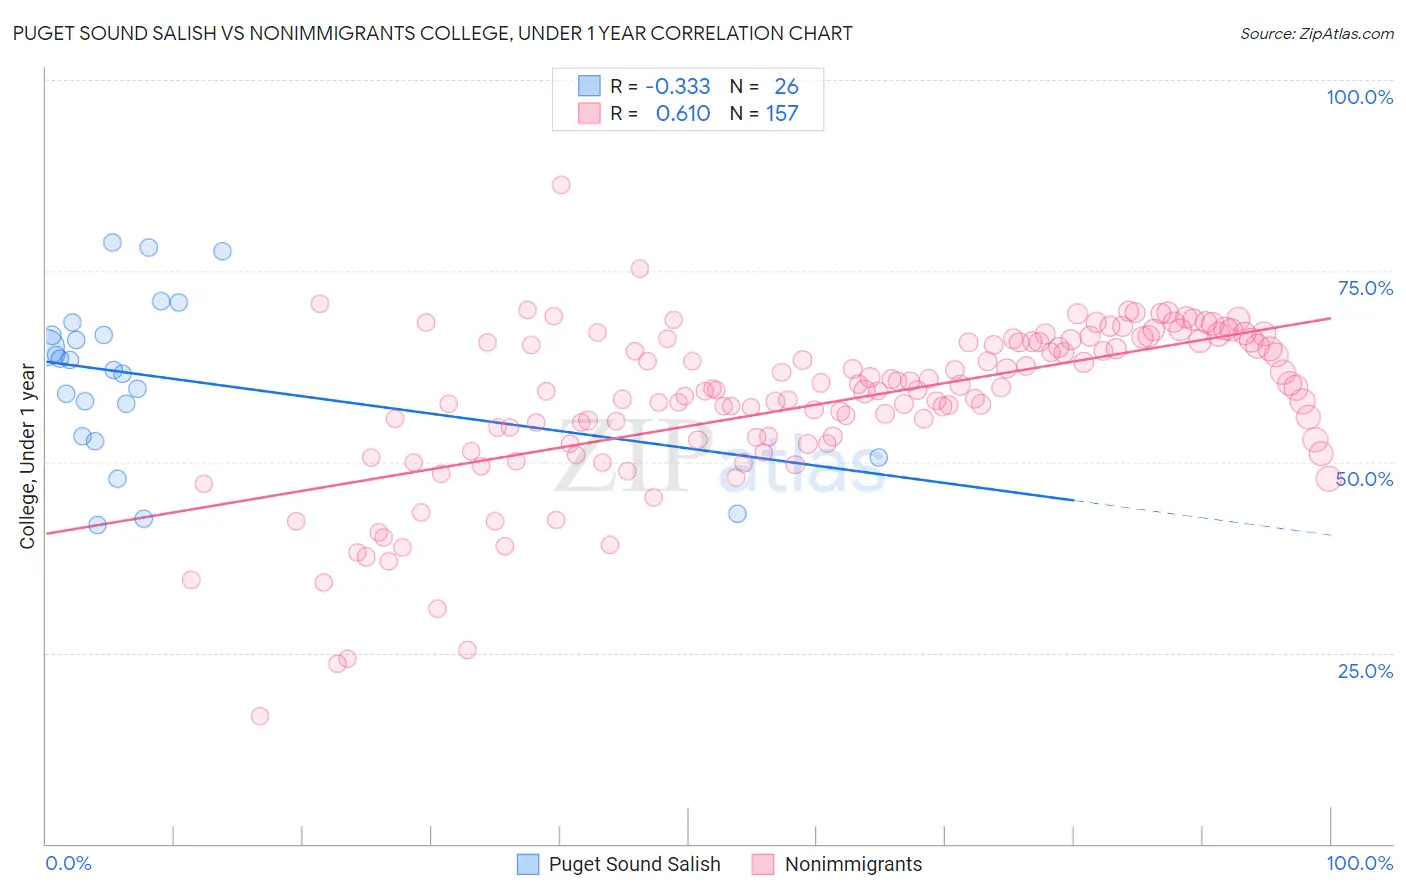
Puget Sound Salish vs Nonimmigrants College, Under 1 year Correlation Chart
The statistical analysis conducted on geographies consisting of 46,155,865 people shows a mild negative correlation between the proportion of Puget Sound Salish and percentage of population with at least college, under 1 year education in the United States with a correlation coefficient (R) of -0.333 and weighted average of 63.9%. Similarly, the statistical analysis conducted on geographies consisting of 585,317,870 people shows a significant positive correlation between the proportion of Nonimmigrants and percentage of population with at least college, under 1 year education in the United States with a correlation coefficient (R) of 0.610 and weighted average of 62.9%, a difference of 1.6%.
College, Under 1 year Correlation Summary
| Measurement | Puget Sound Salish | Nonimmigrants |
| Minimum | 41.7% | 16.7% |
| Maximum | 78.8% | 86.3% |
| Range | 37.1% | 69.6% |
| Mean | 61.1% | 57.6% |
| Median | 62.7% | 59.4% |
| Interquartile 25% (IQ1) | 53.3% | 52.7% |
| Interquartile 75% (IQ3) | 66.7% | 65.7% |
| Interquartile Range (IQR) | 13.3% | 13.0% |
| Standard Deviation (Sample) | 10.4% | 10.8% |
| Standard Deviation (Population) | 10.2% | 10.8% |
Similar Demographics by College, Under 1 year
Demographics Similar to Puget Sound Salish by College, Under 1 year
In terms of college, under 1 year, the demographic groups most similar to Puget Sound Salish are Ghanaian (63.9%, a difference of 0.010%), Native Hawaiian (63.9%, a difference of 0.080%), Immigrants from Vietnam (64.0%, a difference of 0.090%), Immigrants from Middle Africa (63.9%, a difference of 0.090%), and Colombian (64.0%, a difference of 0.12%).
| Demographics | Rating | Rank | College, Under 1 year |
| South Americans | 16.2 /100 | #202 | Poor 64.2% |
| Uruguayans | 15.6 /100 | #203 | Poor 64.2% |
| Immigrants | Zaire | 14.6 /100 | #204 | Poor 64.1% |
| Peruvians | 13.7 /100 | #205 | Poor 64.1% |
| Whites/Caucasians | 12.8 /100 | #206 | Poor 64.0% |
| Colombians | 12.4 /100 | #207 | Poor 64.0% |
| Immigrants | Vietnam | 12.1 /100 | #208 | Poor 64.0% |
| Puget Sound Salish | 11.3 /100 | #209 | Poor 63.9% |
| Ghanaians | 11.2 /100 | #210 | Poor 63.9% |
| Native Hawaiians | 10.6 /100 | #211 | Poor 63.9% |
| Immigrants | Middle Africa | 10.5 /100 | #212 | Poor 63.9% |
| Immigrants | South America | 9.1 /100 | #213 | Tragic 63.8% |
| Immigrants | Nigeria | 8.8 /100 | #214 | Tragic 63.7% |
| Senegalese | 7.7 /100 | #215 | Tragic 63.6% |
| Hmong | 6.8 /100 | #216 | Tragic 63.5% |
Demographics Similar to Nonimmigrants by College, Under 1 year
In terms of college, under 1 year, the demographic groups most similar to Nonimmigrants are Liberian (63.0%, a difference of 0.070%), Samoan (63.0%, a difference of 0.13%), Immigrants from Ghana (63.1%, a difference of 0.24%), Immigrants from Western Africa (62.8%, a difference of 0.24%), and Immigrants from Colombia (63.1%, a difference of 0.33%).
| Demographics | Rating | Rank | College, Under 1 year |
| Immigrants | Costa Rica | 4.5 /100 | #223 | Tragic 63.2% |
| Sub-Saharan Africans | 4.4 /100 | #224 | Tragic 63.2% |
| Immigrants | Peru | 4.0 /100 | #225 | Tragic 63.1% |
| Immigrants | Colombia | 4.0 /100 | #226 | Tragic 63.1% |
| Immigrants | Ghana | 3.7 /100 | #227 | Tragic 63.1% |
| Samoans | 3.3 /100 | #228 | Tragic 63.0% |
| Liberians | 3.2 /100 | #229 | Tragic 63.0% |
| Immigrants | Nonimmigrants | 3.0 /100 | #230 | Tragic 62.9% |
| Immigrants | Western Africa | 2.4 /100 | #231 | Tragic 62.8% |
| Osage | 2.2 /100 | #232 | Tragic 62.7% |
| Iroquois | 2.0 /100 | #233 | Tragic 62.6% |
| Chippewa | 2.0 /100 | #234 | Tragic 62.6% |
| Spanish Americans | 1.9 /100 | #235 | Tragic 62.6% |
| Immigrants | Immigrants | 1.7 /100 | #236 | Tragic 62.5% |
| Immigrants | Burma/Myanmar | 1.6 /100 | #237 | Tragic 62.5% |