Puget Sound Salish vs Houma College, Under 1 year
COMPARE
Puget Sound Salish
Houma
College, Under 1 year
College, Under 1 year Comparison
Puget Sound Salish
Houma
63.9%
COLLEGE, UNDER 1 YEAR
11.3/ 100
METRIC RATING
209th/ 347
METRIC RANK
47.6%
COLLEGE, UNDER 1 YEAR
0.0/ 100
METRIC RATING
346th/ 347
METRIC RANK
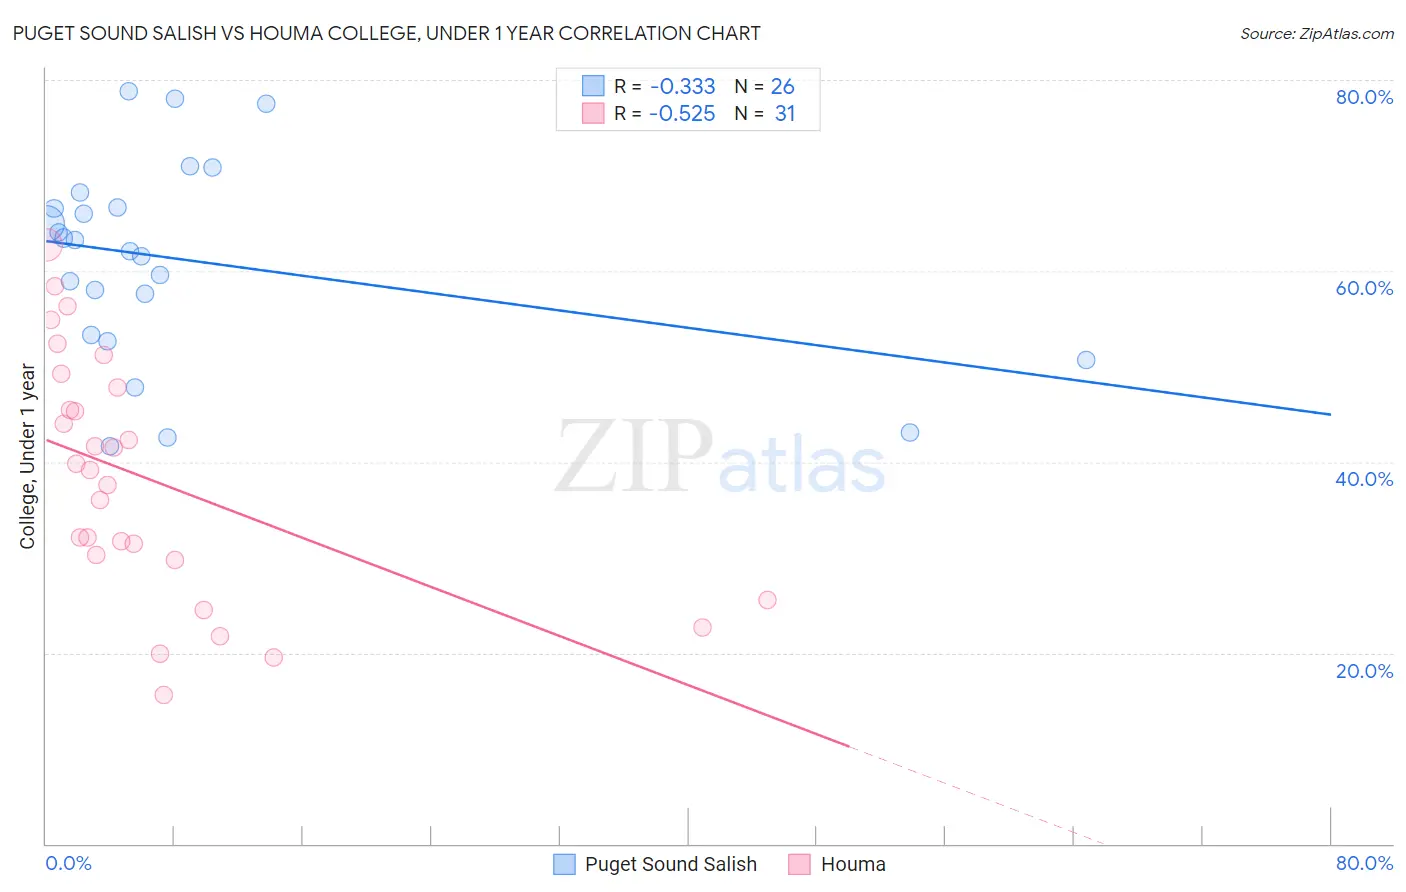
Puget Sound Salish vs Houma College, Under 1 year Correlation Chart
The statistical analysis conducted on geographies consisting of 46,155,865 people shows a mild negative correlation between the proportion of Puget Sound Salish and percentage of population with at least college, under 1 year education in the United States with a correlation coefficient (R) of -0.333 and weighted average of 63.9%. Similarly, the statistical analysis conducted on geographies consisting of 36,795,916 people shows a substantial negative correlation between the proportion of Houma and percentage of population with at least college, under 1 year education in the United States with a correlation coefficient (R) of -0.525 and weighted average of 47.6%, a difference of 34.2%.
College, Under 1 year Correlation Summary
| Measurement | Puget Sound Salish | Houma |
| Minimum | 41.7% | 15.6% |
| Maximum | 78.8% | 62.7% |
| Range | 37.1% | 47.1% |
| Mean | 61.1% | 38.1% |
| Median | 62.7% | 39.1% |
| Interquartile 25% (IQ1) | 53.3% | 29.7% |
| Interquartile 75% (IQ3) | 66.7% | 47.7% |
| Interquartile Range (IQR) | 13.3% | 18.1% |
| Standard Deviation (Sample) | 10.4% | 12.6% |
| Standard Deviation (Population) | 10.2% | 12.4% |
Similar Demographics by College, Under 1 year
Demographics Similar to Puget Sound Salish by College, Under 1 year
In terms of college, under 1 year, the demographic groups most similar to Puget Sound Salish are Ghanaian (63.9%, a difference of 0.010%), Native Hawaiian (63.9%, a difference of 0.080%), Immigrants from Vietnam (64.0%, a difference of 0.090%), Immigrants from Middle Africa (63.9%, a difference of 0.090%), and Colombian (64.0%, a difference of 0.12%).
| Demographics | Rating | Rank | College, Under 1 year |
| South Americans | 16.2 /100 | #202 | Poor 64.2% |
| Uruguayans | 15.6 /100 | #203 | Poor 64.2% |
| Immigrants | Zaire | 14.6 /100 | #204 | Poor 64.1% |
| Peruvians | 13.7 /100 | #205 | Poor 64.1% |
| Whites/Caucasians | 12.8 /100 | #206 | Poor 64.0% |
| Colombians | 12.4 /100 | #207 | Poor 64.0% |
| Immigrants | Vietnam | 12.1 /100 | #208 | Poor 64.0% |
| Puget Sound Salish | 11.3 /100 | #209 | Poor 63.9% |
| Ghanaians | 11.2 /100 | #210 | Poor 63.9% |
| Native Hawaiians | 10.6 /100 | #211 | Poor 63.9% |
| Immigrants | Middle Africa | 10.5 /100 | #212 | Poor 63.9% |
| Immigrants | South America | 9.1 /100 | #213 | Tragic 63.8% |
| Immigrants | Nigeria | 8.8 /100 | #214 | Tragic 63.7% |
| Senegalese | 7.7 /100 | #215 | Tragic 63.6% |
| Hmong | 6.8 /100 | #216 | Tragic 63.5% |
Demographics Similar to Houma by College, Under 1 year
In terms of college, under 1 year, the demographic groups most similar to Houma are Yup'ik (45.8%, a difference of 4.1%), Pima (51.4%, a difference of 7.9%), Yakama (52.6%, a difference of 10.5%), Tohono O'odham (52.8%, a difference of 10.8%), and Immigrants from Mexico (53.7%, a difference of 12.6%).
| Demographics | Rating | Rank | College, Under 1 year |
| Yuman | 0.0 /100 | #333 | Tragic 55.1% |
| Immigrants | Azores | 0.0 /100 | #334 | Tragic 54.7% |
| Inupiat | 0.0 /100 | #335 | Tragic 54.6% |
| Pennsylvania Germans | 0.0 /100 | #336 | Tragic 54.5% |
| Immigrants | Central America | 0.0 /100 | #337 | Tragic 54.4% |
| Lumbee | 0.0 /100 | #338 | Tragic 54.2% |
| Immigrants | Dominican Republic | 0.0 /100 | #339 | Tragic 54.0% |
| Spanish American Indians | 0.0 /100 | #340 | Tragic 54.0% |
| Immigrants | Cabo Verde | 0.0 /100 | #341 | Tragic 53.7% |
| Immigrants | Mexico | 0.0 /100 | #342 | Tragic 53.7% |
| Tohono O'odham | 0.0 /100 | #343 | Tragic 52.8% |
| Yakama | 0.0 /100 | #344 | Tragic 52.6% |
| Pima | 0.0 /100 | #345 | Tragic 51.4% |
| Houma | 0.0 /100 | #346 | Tragic 47.6% |
| Yup'ik | 0.0 /100 | #347 | Tragic 45.8% |