Puget Sound Salish vs Guyanese College, Under 1 year
COMPARE
Puget Sound Salish
Guyanese
College, Under 1 year
College, Under 1 year Comparison
Puget Sound Salish
Guyanese
63.9%
COLLEGE, UNDER 1 YEAR
11.3/ 100
METRIC RATING
209th/ 347
METRIC RANK
59.0%
COLLEGE, UNDER 1 YEAR
0.0/ 100
METRIC RATING
297th/ 347
METRIC RANK
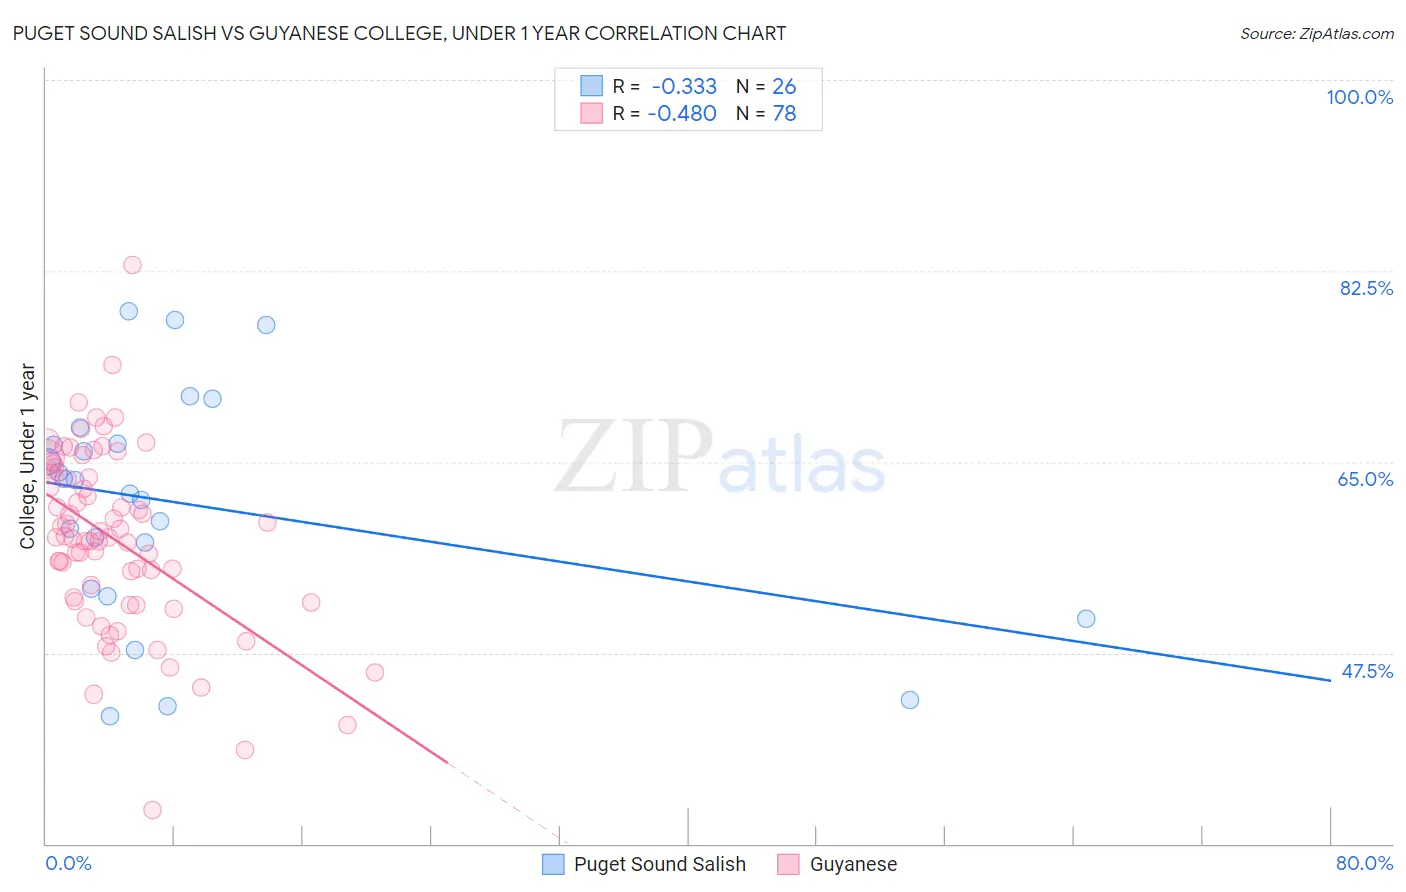
Puget Sound Salish vs Guyanese College, Under 1 year Correlation Chart
The statistical analysis conducted on geographies consisting of 46,155,865 people shows a mild negative correlation between the proportion of Puget Sound Salish and percentage of population with at least college, under 1 year education in the United States with a correlation coefficient (R) of -0.333 and weighted average of 63.9%. Similarly, the statistical analysis conducted on geographies consisting of 176,940,589 people shows a moderate negative correlation between the proportion of Guyanese and percentage of population with at least college, under 1 year education in the United States with a correlation coefficient (R) of -0.480 and weighted average of 59.0%, a difference of 8.3%.
College, Under 1 year Correlation Summary
| Measurement | Puget Sound Salish | Guyanese |
| Minimum | 41.7% | 33.1% |
| Maximum | 78.8% | 83.1% |
| Range | 37.1% | 50.0% |
| Mean | 61.1% | 57.9% |
| Median | 62.7% | 58.1% |
| Interquartile 25% (IQ1) | 53.3% | 52.3% |
| Interquartile 75% (IQ3) | 66.7% | 64.0% |
| Interquartile Range (IQR) | 13.3% | 11.7% |
| Standard Deviation (Sample) | 10.4% | 8.4% |
| Standard Deviation (Population) | 10.2% | 8.3% |
Similar Demographics by College, Under 1 year
Demographics Similar to Puget Sound Salish by College, Under 1 year
In terms of college, under 1 year, the demographic groups most similar to Puget Sound Salish are Ghanaian (63.9%, a difference of 0.010%), Native Hawaiian (63.9%, a difference of 0.080%), Immigrants from Vietnam (64.0%, a difference of 0.090%), Immigrants from Middle Africa (63.9%, a difference of 0.090%), and Colombian (64.0%, a difference of 0.12%).
| Demographics | Rating | Rank | College, Under 1 year |
| South Americans | 16.2 /100 | #202 | Poor 64.2% |
| Uruguayans | 15.6 /100 | #203 | Poor 64.2% |
| Immigrants | Zaire | 14.6 /100 | #204 | Poor 64.1% |
| Peruvians | 13.7 /100 | #205 | Poor 64.1% |
| Whites/Caucasians | 12.8 /100 | #206 | Poor 64.0% |
| Colombians | 12.4 /100 | #207 | Poor 64.0% |
| Immigrants | Vietnam | 12.1 /100 | #208 | Poor 64.0% |
| Puget Sound Salish | 11.3 /100 | #209 | Poor 63.9% |
| Ghanaians | 11.2 /100 | #210 | Poor 63.9% |
| Native Hawaiians | 10.6 /100 | #211 | Poor 63.9% |
| Immigrants | Middle Africa | 10.5 /100 | #212 | Poor 63.9% |
| Immigrants | South America | 9.1 /100 | #213 | Tragic 63.8% |
| Immigrants | Nigeria | 8.8 /100 | #214 | Tragic 63.7% |
| Senegalese | 7.7 /100 | #215 | Tragic 63.6% |
| Hmong | 6.8 /100 | #216 | Tragic 63.5% |
Demographics Similar to Guyanese by College, Under 1 year
In terms of college, under 1 year, the demographic groups most similar to Guyanese are Central American Indian (59.0%, a difference of 0.040%), Immigrants from Grenada (59.1%, a difference of 0.080%), Immigrants from Belize (59.1%, a difference of 0.19%), Seminole (59.1%, a difference of 0.21%), and Nicaraguan (59.2%, a difference of 0.39%).
| Demographics | Rating | Rank | College, Under 1 year |
| Ecuadorians | 0.0 /100 | #290 | Tragic 59.3% |
| Creek | 0.0 /100 | #291 | Tragic 59.3% |
| Nicaraguans | 0.0 /100 | #292 | Tragic 59.2% |
| Seminole | 0.0 /100 | #293 | Tragic 59.1% |
| Immigrants | Belize | 0.0 /100 | #294 | Tragic 59.1% |
| Immigrants | Grenada | 0.0 /100 | #295 | Tragic 59.1% |
| Central American Indians | 0.0 /100 | #296 | Tragic 59.0% |
| Guyanese | 0.0 /100 | #297 | Tragic 59.0% |
| Immigrants | Ecuador | 0.0 /100 | #298 | Tragic 58.7% |
| Cubans | 0.0 /100 | #299 | Tragic 58.6% |
| Immigrants | Guyana | 0.0 /100 | #300 | Tragic 58.5% |
| Mexican American Indians | 0.0 /100 | #301 | Tragic 58.1% |
| Apache | 0.0 /100 | #302 | Tragic 58.0% |
| Immigrants | Dominica | 0.0 /100 | #303 | Tragic 57.9% |
| Kiowa | 0.0 /100 | #304 | Tragic 57.8% |