Immigrants from Senegal vs Ottawa College, Under 1 year
COMPARE
Immigrants from Senegal
Ottawa
College, Under 1 year
College, Under 1 year Comparison
Immigrants from Senegal
Ottawa
63.3%
COLLEGE, UNDER 1 YEAR
5.0/ 100
METRIC RATING
222nd/ 347
METRIC RANK
62.2%
COLLEGE, UNDER 1 YEAR
1.1/ 100
METRIC RATING
241st/ 347
METRIC RANK
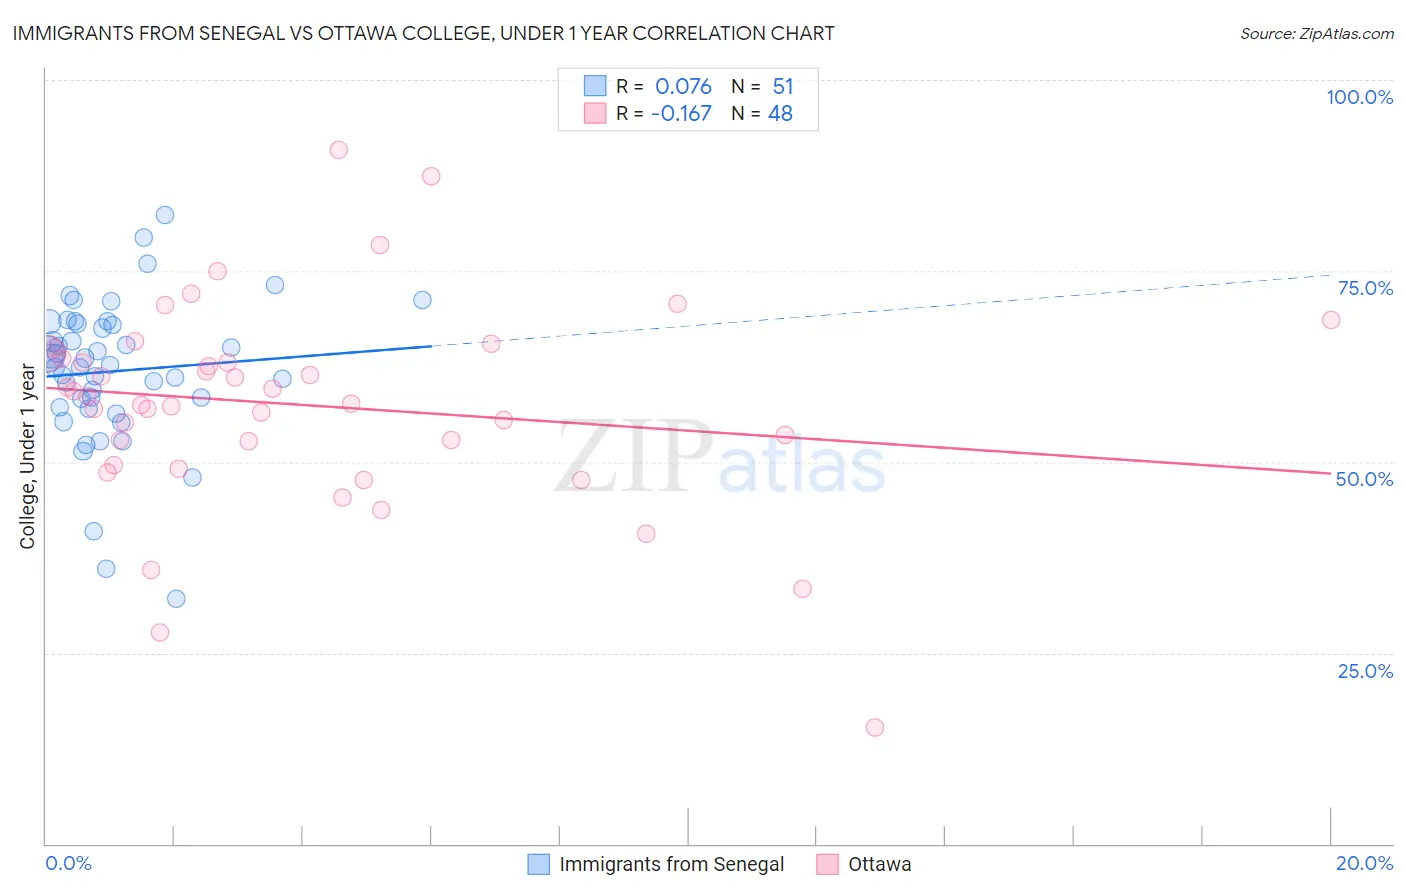
Immigrants from Senegal vs Ottawa College, Under 1 year Correlation Chart
The statistical analysis conducted on geographies consisting of 90,129,295 people shows a slight positive correlation between the proportion of Immigrants from Senegal and percentage of population with at least college, under 1 year education in the United States with a correlation coefficient (R) of 0.076 and weighted average of 63.3%. Similarly, the statistical analysis conducted on geographies consisting of 49,956,726 people shows a poor negative correlation between the proportion of Ottawa and percentage of population with at least college, under 1 year education in the United States with a correlation coefficient (R) of -0.167 and weighted average of 62.2%, a difference of 1.8%.
College, Under 1 year Correlation Summary
| Measurement | Immigrants from Senegal | Ottawa |
| Minimum | 32.1% | 15.3% |
| Maximum | 82.4% | 90.8% |
| Range | 50.2% | 75.6% |
| Mean | 61.9% | 57.5% |
| Median | 62.6% | 58.1% |
| Interquartile 25% (IQ1) | 57.1% | 51.2% |
| Interquartile 75% (IQ3) | 68.1% | 63.8% |
| Interquartile Range (IQR) | 11.0% | 12.6% |
| Standard Deviation (Sample) | 9.5% | 13.6% |
| Standard Deviation (Population) | 9.4% | 13.5% |
Demographics Similar to Immigrants from Senegal and Ottawa by College, Under 1 year
In terms of college, under 1 year, the demographic groups most similar to Immigrants from Senegal are Cree (63.3%, a difference of 0.050%), Immigrants from Costa Rica (63.2%, a difference of 0.12%), Subsaharan African (63.2%, a difference of 0.15%), Immigrants from Peru (63.1%, a difference of 0.25%), and Immigrants from Colombia (63.1%, a difference of 0.27%). Similarly, the demographic groups most similar to Ottawa are Nepalese (62.2%, a difference of 0.010%), Aleut (62.2%, a difference of 0.010%), French American Indian (62.4%, a difference of 0.35%), Immigrants from Burma/Myanmar (62.5%, a difference of 0.44%), and Immigrants (62.5%, a difference of 0.48%).
| Demographics | Rating | Rank | College, Under 1 year |
| Cree | 5.2 /100 | #221 | Tragic 63.3% |
| Immigrants | Senegal | 5.0 /100 | #222 | Tragic 63.3% |
| Immigrants | Costa Rica | 4.5 /100 | #223 | Tragic 63.2% |
| Sub-Saharan Africans | 4.4 /100 | #224 | Tragic 63.2% |
| Immigrants | Peru | 4.0 /100 | #225 | Tragic 63.1% |
| Immigrants | Colombia | 4.0 /100 | #226 | Tragic 63.1% |
| Immigrants | Ghana | 3.7 /100 | #227 | Tragic 63.1% |
| Samoans | 3.3 /100 | #228 | Tragic 63.0% |
| Liberians | 3.2 /100 | #229 | Tragic 63.0% |
| Immigrants | Nonimmigrants | 3.0 /100 | #230 | Tragic 62.9% |
| Immigrants | Western Africa | 2.4 /100 | #231 | Tragic 62.8% |
| Osage | 2.2 /100 | #232 | Tragic 62.7% |
| Iroquois | 2.0 /100 | #233 | Tragic 62.6% |
| Chippewa | 2.0 /100 | #234 | Tragic 62.6% |
| Spanish Americans | 1.9 /100 | #235 | Tragic 62.6% |
| Immigrants | Immigrants | 1.7 /100 | #236 | Tragic 62.5% |
| Immigrants | Burma/Myanmar | 1.6 /100 | #237 | Tragic 62.5% |
| French American Indians | 1.5 /100 | #238 | Tragic 62.4% |
| Nepalese | 1.1 /100 | #239 | Tragic 62.2% |
| Aleuts | 1.1 /100 | #240 | Tragic 62.2% |
| Ottawa | 1.1 /100 | #241 | Tragic 62.2% |