Potawatomi vs Austrian Unemployment Among Women with Children Under 18 years
COMPARE
Potawatomi
Austrian
Unemployment Among Women with Children Under 18 years
Unemployment Among Women with Children Under 18 years Comparison
Potawatomi
Austrians
5.7%
UNEMPLOYMENT AMONG WOMEN WITH CHILDREN UNDER 18 YEARS
5.0/ 100
METRIC RATING
223rd/ 347
METRIC RANK
5.1%
UNEMPLOYMENT AMONG WOMEN WITH CHILDREN UNDER 18 YEARS
96.6/ 100
METRIC RATING
69th/ 347
METRIC RANK
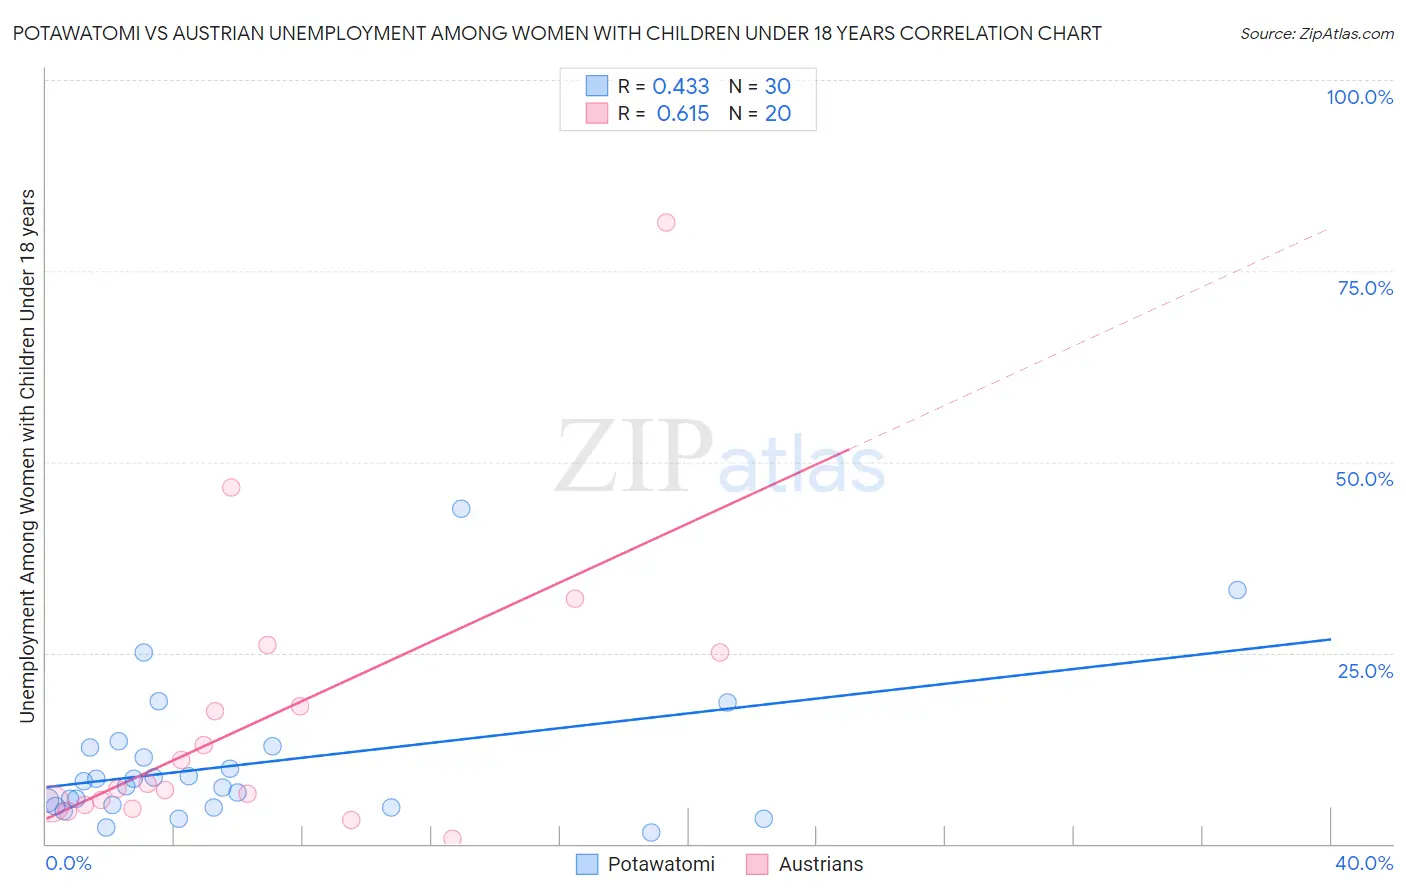
Potawatomi vs Austrian Unemployment Among Women with Children Under 18 years Correlation Chart
The statistical analysis conducted on geographies consisting of 115,059,892 people shows a moderate positive correlation between the proportion of Potawatomi and unemployment rate among women with children under the age of 18 in the United States with a correlation coefficient (R) of 0.433 and weighted average of 5.7%. Similarly, the statistical analysis conducted on geographies consisting of 424,667,756 people shows a significant positive correlation between the proportion of Austrians and unemployment rate among women with children under the age of 18 in the United States with a correlation coefficient (R) of 0.615 and weighted average of 5.1%, a difference of 11.9%.
Unemployment Among Women with Children Under 18 years Correlation Summary
| Measurement | Potawatomi | Austrian |
| Minimum | 1.4% | 0.60% |
| Maximum | 43.8% | 81.3% |
| Range | 42.4% | 80.7% |
| Mean | 10.5% | 16.4% |
| Median | 7.9% | 7.5% |
| Interquartile 25% (IQ1) | 4.9% | 5.2% |
| Interquartile 75% (IQ3) | 12.5% | 21.5% |
| Interquartile Range (IQR) | 7.6% | 16.3% |
| Standard Deviation (Sample) | 9.3% | 19.2% |
| Standard Deviation (Population) | 9.2% | 18.7% |
Similar Demographics by Unemployment Among Women with Children Under 18 years
Demographics Similar to Potawatomi by Unemployment Among Women with Children Under 18 years
In terms of unemployment among women with children under 18 years, the demographic groups most similar to Potawatomi are Osage (5.7%, a difference of 0.020%), Immigrants from Syria (5.7%, a difference of 0.14%), Armenian (5.7%, a difference of 0.19%), Pennsylvania German (5.7%, a difference of 0.24%), and Cherokee (5.7%, a difference of 0.26%).
| Demographics | Rating | Rank | Unemployment Among Women with Children Under 18 years |
| Immigrants | Peru | 7.4 /100 | #216 | Tragic 5.7% |
| Immigrants | Brazil | 7.1 /100 | #217 | Tragic 5.7% |
| Immigrants | Nicaragua | 7.0 /100 | #218 | Tragic 5.7% |
| Iroquois | 6.5 /100 | #219 | Tragic 5.7% |
| Immigrants | Fiji | 6.3 /100 | #220 | Tragic 5.7% |
| Pennsylvania Germans | 5.7 /100 | #221 | Tragic 5.7% |
| Osage | 5.0 /100 | #222 | Tragic 5.7% |
| Potawatomi | 5.0 /100 | #223 | Tragic 5.7% |
| Immigrants | Syria | 4.6 /100 | #224 | Tragic 5.7% |
| Armenians | 4.5 /100 | #225 | Tragic 5.7% |
| Cherokee | 4.3 /100 | #226 | Tragic 5.7% |
| Sierra Leoneans | 3.8 /100 | #227 | Tragic 5.8% |
| Somalis | 3.5 /100 | #228 | Tragic 5.8% |
| Immigrants | Panama | 3.4 /100 | #229 | Tragic 5.8% |
| Immigrants | South America | 3.2 /100 | #230 | Tragic 5.8% |
Demographics Similar to Austrians by Unemployment Among Women with Children Under 18 years
In terms of unemployment among women with children under 18 years, the demographic groups most similar to Austrians are Icelander (5.1%, a difference of 0.0%), Serbian (5.1%, a difference of 0.040%), Irish (5.1%, a difference of 0.14%), Fijian (5.1%, a difference of 0.23%), and Immigrants from Australia (5.1%, a difference of 0.25%).
| Demographics | Rating | Rank | Unemployment Among Women with Children Under 18 years |
| Immigrants | Bulgaria | 97.4 /100 | #62 | Exceptional 5.1% |
| Italians | 97.4 /100 | #63 | Exceptional 5.1% |
| Estonians | 97.2 /100 | #64 | Exceptional 5.1% |
| Immigrants | Sweden | 97.1 /100 | #65 | Exceptional 5.1% |
| Immigrants | Australia | 97.0 /100 | #66 | Exceptional 5.1% |
| Fijians | 96.9 /100 | #67 | Exceptional 5.1% |
| Irish | 96.8 /100 | #68 | Exceptional 5.1% |
| Austrians | 96.6 /100 | #69 | Exceptional 5.1% |
| Icelanders | 96.6 /100 | #70 | Exceptional 5.1% |
| Serbians | 96.5 /100 | #71 | Exceptional 5.1% |
| Immigrants | Bolivia | 96.1 /100 | #72 | Exceptional 5.1% |
| Albanians | 95.9 /100 | #73 | Exceptional 5.1% |
| Immigrants | Northern Europe | 95.9 /100 | #74 | Exceptional 5.1% |
| Immigrants | Asia | 95.8 /100 | #75 | Exceptional 5.1% |
| Puget Sound Salish | 95.8 /100 | #76 | Exceptional 5.1% |