Tongan vs Austrian GED/Equivalency
COMPARE
Tongan
Austrian
GED/Equivalency
GED/Equivalency Comparison
Tongans
Austrians
85.2%
GED/EQUIVALENCY
20.7/ 100
METRIC RATING
196th/ 347
METRIC RANK
87.7%
GED/EQUIVALENCY
98.8/ 100
METRIC RATING
71st/ 347
METRIC RANK
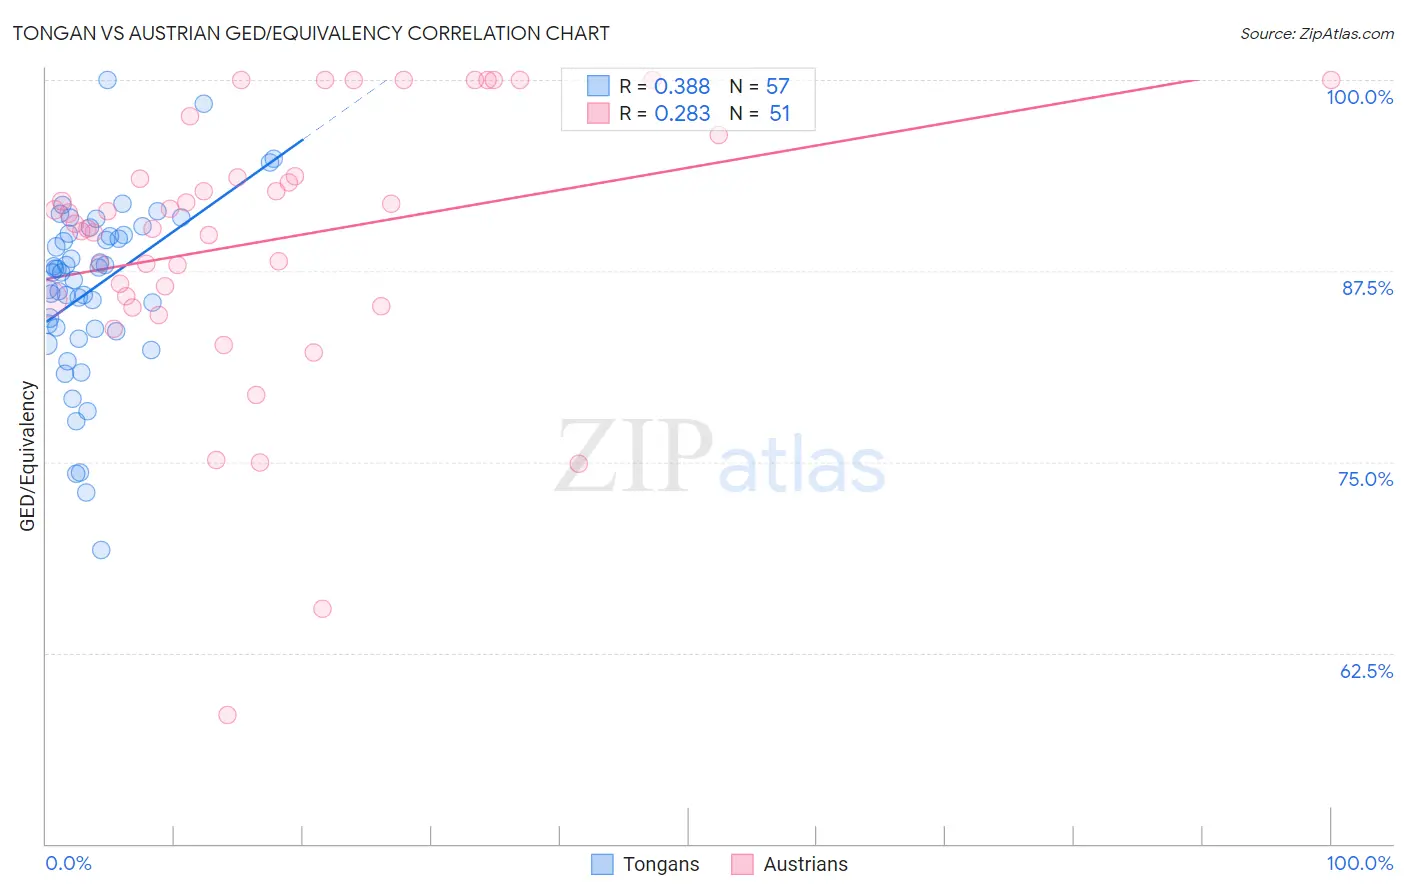
Tongan vs Austrian GED/Equivalency Correlation Chart
The statistical analysis conducted on geographies consisting of 102,904,773 people shows a mild positive correlation between the proportion of Tongans and percentage of population with at least ged/equivalency education in the United States with a correlation coefficient (R) of 0.388 and weighted average of 85.2%. Similarly, the statistical analysis conducted on geographies consisting of 452,082,927 people shows a weak positive correlation between the proportion of Austrians and percentage of population with at least ged/equivalency education in the United States with a correlation coefficient (R) of 0.283 and weighted average of 87.7%, a difference of 3.0%.
GED/Equivalency Correlation Summary
| Measurement | Tongan | Austrian |
| Minimum | 69.2% | 58.5% |
| Maximum | 100.0% | 100.0% |
| Range | 30.8% | 41.5% |
| Mean | 86.4% | 89.5% |
| Median | 87.4% | 90.6% |
| Interquartile 25% (IQ1) | 83.6% | 85.7% |
| Interquartile 75% (IQ3) | 89.9% | 93.7% |
| Interquartile Range (IQR) | 6.3% | 8.0% |
| Standard Deviation (Sample) | 5.8% | 8.8% |
| Standard Deviation (Population) | 5.8% | 8.7% |
Similar Demographics by GED/Equivalency
Demographics Similar to Tongans by GED/Equivalency
In terms of ged/equivalency, the demographic groups most similar to Tongans are Puget Sound Salish (85.2%, a difference of 0.0%), Chippewa (85.2%, a difference of 0.0%), Costa Rican (85.2%, a difference of 0.010%), Delaware (85.2%, a difference of 0.050%), and South American Indian (85.2%, a difference of 0.060%).
| Demographics | Rating | Rank | GED/Equivalency |
| Guamanians/Chamorros | 28.4 /100 | #189 | Fair 85.3% |
| Alaskan Athabascans | 27.5 /100 | #190 | Fair 85.3% |
| South American Indians | 22.8 /100 | #191 | Fair 85.2% |
| Immigrants | Nonimmigrants | 22.7 /100 | #192 | Fair 85.2% |
| Delaware | 22.2 /100 | #193 | Fair 85.2% |
| Puget Sound Salish | 20.8 /100 | #194 | Fair 85.2% |
| Chippewa | 20.8 /100 | #195 | Fair 85.2% |
| Tongans | 20.7 /100 | #196 | Fair 85.2% |
| Costa Ricans | 20.4 /100 | #197 | Fair 85.2% |
| Immigrants | Africa | 17.5 /100 | #198 | Poor 85.1% |
| Somalis | 16.4 /100 | #199 | Poor 85.0% |
| Uruguayans | 16.0 /100 | #200 | Poor 85.0% |
| Portuguese | 15.9 /100 | #201 | Poor 85.0% |
| Cree | 15.9 /100 | #202 | Poor 85.0% |
| Panamanians | 15.3 /100 | #203 | Poor 85.0% |
Demographics Similar to Austrians by GED/Equivalency
In terms of ged/equivalency, the demographic groups most similar to Austrians are Ukrainian (87.7%, a difference of 0.0%), Immigrants from Moldova (87.7%, a difference of 0.0%), Belgian (87.7%, a difference of 0.010%), Immigrants from Kuwait (87.7%, a difference of 0.030%), and Immigrants from Saudi Arabia (87.8%, a difference of 0.050%).
| Demographics | Rating | Rank | GED/Equivalency |
| Immigrants | Canada | 99.2 /100 | #64 | Exceptional 87.9% |
| Immigrants | North America | 99.1 /100 | #65 | Exceptional 87.8% |
| Immigrants | Bulgaria | 99.1 /100 | #66 | Exceptional 87.8% |
| British | 99.1 /100 | #67 | Exceptional 87.8% |
| Immigrants | France | 99.1 /100 | #68 | Exceptional 87.8% |
| Immigrants | Saudi Arabia | 99.0 /100 | #69 | Exceptional 87.8% |
| Ukrainians | 98.8 /100 | #70 | Exceptional 87.7% |
| Austrians | 98.8 /100 | #71 | Exceptional 87.7% |
| Immigrants | Moldova | 98.8 /100 | #72 | Exceptional 87.7% |
| Belgians | 98.8 /100 | #73 | Exceptional 87.7% |
| Immigrants | Kuwait | 98.8 /100 | #74 | Exceptional 87.7% |
| Scottish | 98.7 /100 | #75 | Exceptional 87.7% |
| Immigrants | Serbia | 98.7 /100 | #76 | Exceptional 87.7% |
| Slavs | 98.7 /100 | #77 | Exceptional 87.7% |
| Irish | 98.6 /100 | #78 | Exceptional 87.6% |