Inupiat vs Austrian GED/Equivalency
COMPARE
Inupiat
Austrian
GED/Equivalency
GED/Equivalency Comparison
Inupiat
Austrians
83.1%
GED/EQUIVALENCY
0.2/ 100
METRIC RATING
261st/ 347
METRIC RANK
87.7%
GED/EQUIVALENCY
98.8/ 100
METRIC RATING
71st/ 347
METRIC RANK
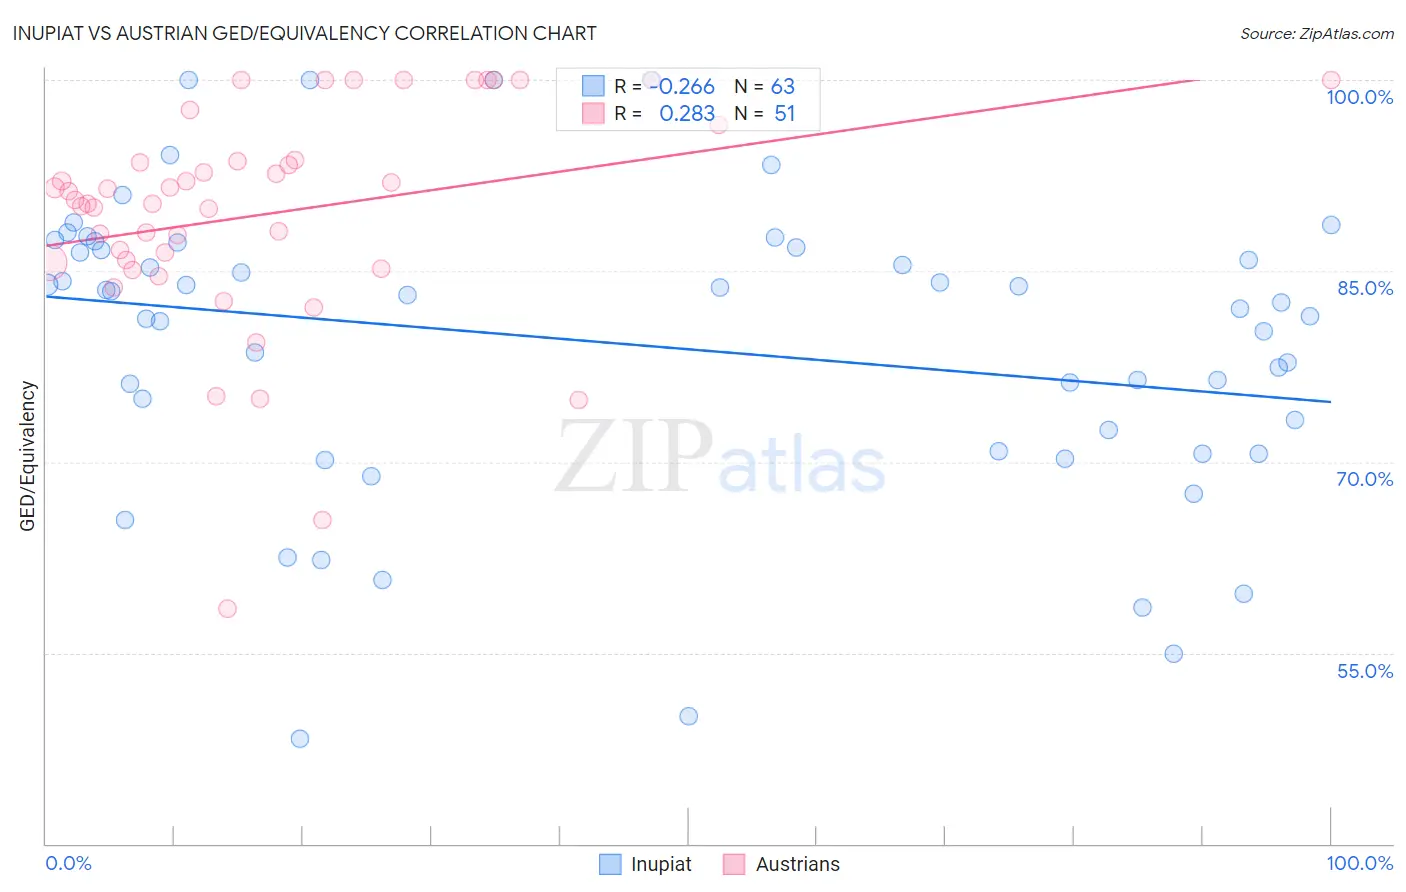
Inupiat vs Austrian GED/Equivalency Correlation Chart
The statistical analysis conducted on geographies consisting of 96,349,240 people shows a weak negative correlation between the proportion of Inupiat and percentage of population with at least ged/equivalency education in the United States with a correlation coefficient (R) of -0.266 and weighted average of 83.1%. Similarly, the statistical analysis conducted on geographies consisting of 452,082,927 people shows a weak positive correlation between the proportion of Austrians and percentage of population with at least ged/equivalency education in the United States with a correlation coefficient (R) of 0.283 and weighted average of 87.7%, a difference of 5.6%.
GED/Equivalency Correlation Summary
| Measurement | Inupiat | Austrian |
| Minimum | 48.2% | 58.5% |
| Maximum | 100.0% | 100.0% |
| Range | 51.8% | 41.5% |
| Mean | 79.3% | 89.5% |
| Median | 82.5% | 90.6% |
| Interquartile 25% (IQ1) | 70.8% | 85.7% |
| Interquartile 75% (IQ3) | 86.8% | 93.7% |
| Interquartile Range (IQR) | 16.0% | 8.0% |
| Standard Deviation (Sample) | 11.7% | 8.8% |
| Standard Deviation (Population) | 11.6% | 8.7% |
Similar Demographics by GED/Equivalency
Demographics Similar to Inupiat by GED/Equivalency
In terms of ged/equivalency, the demographic groups most similar to Inupiat are Immigrants from Armenia (83.1%, a difference of 0.0%), Immigrants from Congo (83.1%, a difference of 0.010%), Bangladeshi (83.1%, a difference of 0.020%), West Indian (83.1%, a difference of 0.030%), and Kiowa (83.1%, a difference of 0.040%).
| Demographics | Rating | Rank | GED/Equivalency |
| Creek | 0.7 /100 | #254 | Tragic 83.6% |
| Colville | 0.5 /100 | #255 | Tragic 83.4% |
| Africans | 0.5 /100 | #256 | Tragic 83.4% |
| Jamaicans | 0.4 /100 | #257 | Tragic 83.3% |
| Malaysians | 0.4 /100 | #258 | Tragic 83.3% |
| Immigrants | Vietnam | 0.3 /100 | #259 | Tragic 83.2% |
| Choctaw | 0.3 /100 | #260 | Tragic 83.1% |
| Inupiat | 0.2 /100 | #261 | Tragic 83.1% |
| Immigrants | Armenia | 0.2 /100 | #262 | Tragic 83.1% |
| Immigrants | Congo | 0.2 /100 | #263 | Tragic 83.1% |
| Bangladeshis | 0.2 /100 | #264 | Tragic 83.1% |
| West Indians | 0.2 /100 | #265 | Tragic 83.1% |
| Kiowa | 0.2 /100 | #266 | Tragic 83.1% |
| Trinidadians and Tobagonians | 0.2 /100 | #267 | Tragic 83.0% |
| Immigrants | Burma/Myanmar | 0.2 /100 | #268 | Tragic 83.0% |
Demographics Similar to Austrians by GED/Equivalency
In terms of ged/equivalency, the demographic groups most similar to Austrians are Ukrainian (87.7%, a difference of 0.0%), Immigrants from Moldova (87.7%, a difference of 0.0%), Belgian (87.7%, a difference of 0.010%), Immigrants from Kuwait (87.7%, a difference of 0.030%), and Immigrants from Saudi Arabia (87.8%, a difference of 0.050%).
| Demographics | Rating | Rank | GED/Equivalency |
| Immigrants | Canada | 99.2 /100 | #64 | Exceptional 87.9% |
| Immigrants | North America | 99.1 /100 | #65 | Exceptional 87.8% |
| Immigrants | Bulgaria | 99.1 /100 | #66 | Exceptional 87.8% |
| British | 99.1 /100 | #67 | Exceptional 87.8% |
| Immigrants | France | 99.1 /100 | #68 | Exceptional 87.8% |
| Immigrants | Saudi Arabia | 99.0 /100 | #69 | Exceptional 87.8% |
| Ukrainians | 98.8 /100 | #70 | Exceptional 87.7% |
| Austrians | 98.8 /100 | #71 | Exceptional 87.7% |
| Immigrants | Moldova | 98.8 /100 | #72 | Exceptional 87.7% |
| Belgians | 98.8 /100 | #73 | Exceptional 87.7% |
| Immigrants | Kuwait | 98.8 /100 | #74 | Exceptional 87.7% |
| Scottish | 98.7 /100 | #75 | Exceptional 87.7% |
| Immigrants | Serbia | 98.7 /100 | #76 | Exceptional 87.7% |
| Slavs | 98.7 /100 | #77 | Exceptional 87.7% |
| Irish | 98.6 /100 | #78 | Exceptional 87.6% |