Peruvian vs Immigrants from Moldova Master's Degree
COMPARE
Peruvian
Immigrants from Moldova
Master's Degree
Master's Degree Comparison
Peruvians
Immigrants from Moldova
15.3%
MASTER'S DEGREE
68.7/ 100
METRIC RATING
162nd/ 347
METRIC RANK
16.6%
MASTER'S DEGREE
97.2/ 100
METRIC RATING
117th/ 347
METRIC RANK
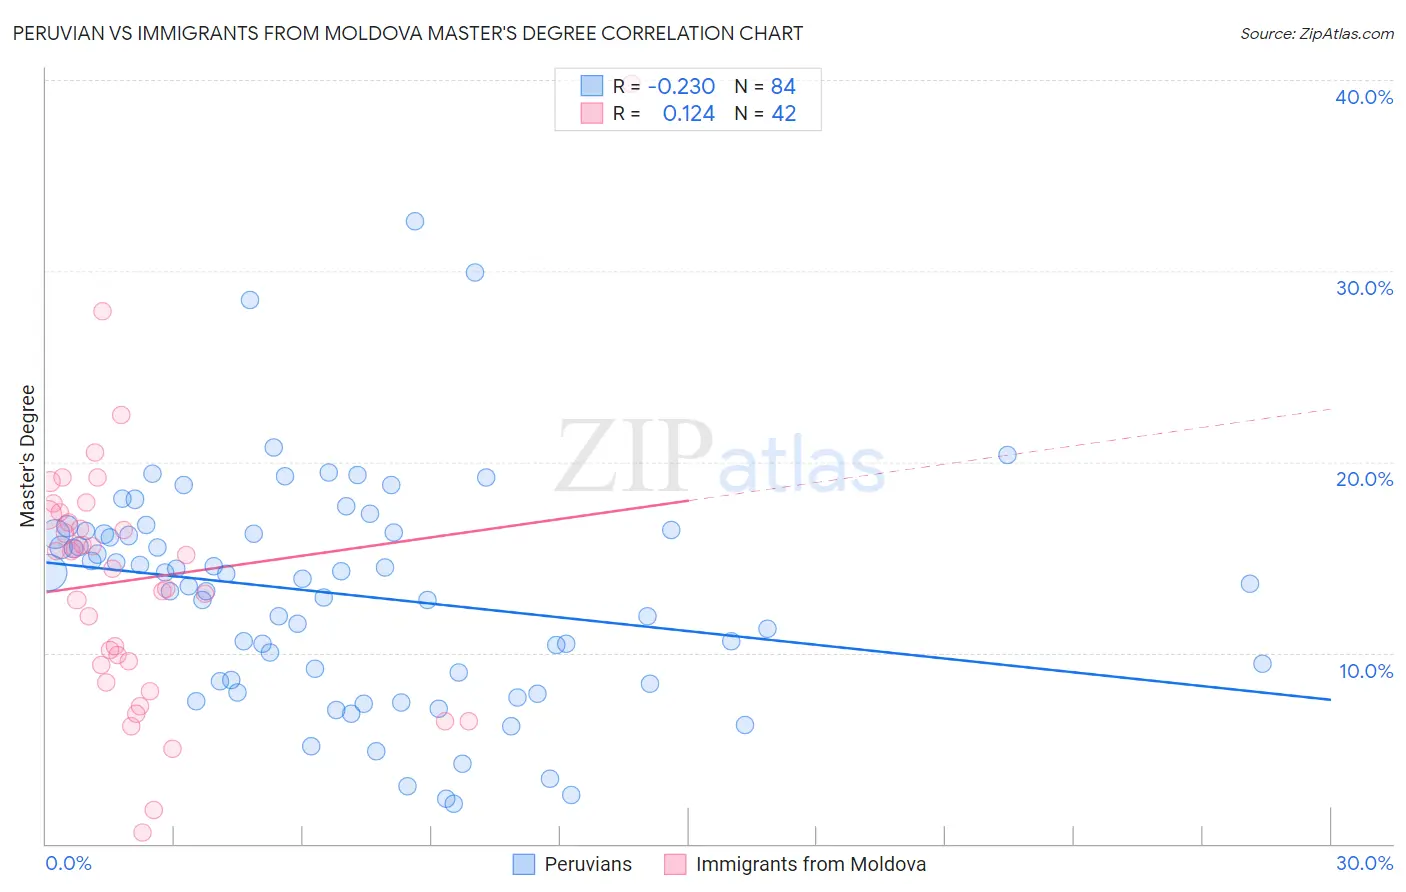
Peruvian vs Immigrants from Moldova Master's Degree Correlation Chart
The statistical analysis conducted on geographies consisting of 363,142,286 people shows a weak negative correlation between the proportion of Peruvians and percentage of population with at least master's degree education in the United States with a correlation coefficient (R) of -0.230 and weighted average of 15.3%. Similarly, the statistical analysis conducted on geographies consisting of 124,394,558 people shows a poor positive correlation between the proportion of Immigrants from Moldova and percentage of population with at least master's degree education in the United States with a correlation coefficient (R) of 0.124 and weighted average of 16.6%, a difference of 8.6%.
Master's Degree Correlation Summary
| Measurement | Peruvian | Immigrants from Moldova |
| Minimum | 2.1% | 0.61% |
| Maximum | 32.6% | 39.8% |
| Range | 30.5% | 39.2% |
| Mean | 13.1% | 13.8% |
| Median | 13.8% | 14.7% |
| Interquartile 25% (IQ1) | 8.6% | 9.4% |
| Interquartile 75% (IQ3) | 16.3% | 17.2% |
| Interquartile Range (IQR) | 7.7% | 7.9% |
| Standard Deviation (Sample) | 5.8% | 7.0% |
| Standard Deviation (Population) | 5.8% | 6.9% |
Similar Demographics by Master's Degree
Demographics Similar to Peruvians by Master's Degree
In terms of master's degree, the demographic groups most similar to Peruvians are Sudanese (15.3%, a difference of 0.010%), Uruguayan (15.3%, a difference of 0.22%), Kenyan (15.3%, a difference of 0.24%), Colombian (15.3%, a difference of 0.25%), and Immigrants from Kenya (15.3%, a difference of 0.29%).
| Demographics | Rating | Rank | Master's Degree |
| Immigrants | Bangladesh | 76.1 /100 | #155 | Good 15.5% |
| Bermudans | 73.9 /100 | #156 | Good 15.4% |
| Immigrants | Cameroon | 71.7 /100 | #157 | Good 15.4% |
| Immigrants | Poland | 71.5 /100 | #158 | Good 15.4% |
| Luxembourgers | 71.0 /100 | #159 | Good 15.3% |
| Kenyans | 70.3 /100 | #160 | Good 15.3% |
| Sudanese | 68.7 /100 | #161 | Good 15.3% |
| Peruvians | 68.7 /100 | #162 | Good 15.3% |
| Uruguayans | 67.1 /100 | #163 | Good 15.3% |
| Colombians | 66.9 /100 | #164 | Good 15.3% |
| Immigrants | Kenya | 66.6 /100 | #165 | Good 15.3% |
| Swedes | 66.1 /100 | #166 | Good 15.2% |
| Senegalese | 65.6 /100 | #167 | Good 15.2% |
| Immigrants | North Macedonia | 64.5 /100 | #168 | Good 15.2% |
| Scottish | 62.7 /100 | #169 | Good 15.2% |
Demographics Similar to Immigrants from Moldova by Master's Degree
In terms of master's degree, the demographic groups most similar to Immigrants from Moldova are Immigrants from Southern Europe (16.6%, a difference of 0.010%), Immigrants from Uganda (16.6%, a difference of 0.13%), Brazilian (16.5%, a difference of 0.42%), Northern European (16.7%, a difference of 0.43%), and Arab (16.7%, a difference of 0.50%).
| Demographics | Rating | Rank | Master's Degree |
| Immigrants | Chile | 98.0 /100 | #110 | Exceptional 16.8% |
| Austrians | 97.8 /100 | #111 | Exceptional 16.7% |
| Macedonians | 97.7 /100 | #112 | Exceptional 16.7% |
| Arabs | 97.7 /100 | #113 | Exceptional 16.7% |
| Northern Europeans | 97.6 /100 | #114 | Exceptional 16.7% |
| Immigrants | Uganda | 97.3 /100 | #115 | Exceptional 16.6% |
| Immigrants | Southern Europe | 97.2 /100 | #116 | Exceptional 16.6% |
| Immigrants | Moldova | 97.2 /100 | #117 | Exceptional 16.6% |
| Brazilians | 96.8 /100 | #118 | Exceptional 16.5% |
| Jordanians | 96.5 /100 | #119 | Exceptional 16.5% |
| Lebanese | 96.4 /100 | #120 | Exceptional 16.5% |
| Afghans | 96.2 /100 | #121 | Exceptional 16.5% |
| British | 95.6 /100 | #122 | Exceptional 16.4% |
| Croatians | 95.6 /100 | #123 | Exceptional 16.4% |
| Immigrants | Eritrea | 95.5 /100 | #124 | Exceptional 16.4% |