Aleut vs Immigrants from Nepal Master's Degree
COMPARE
Aleut
Immigrants from Nepal
Master's Degree
Master's Degree Comparison
Aleuts
Immigrants from Nepal
11.8%
MASTER'S DEGREE
0.1/ 100
METRIC RATING
286th/ 347
METRIC RANK
17.0%
MASTER'S DEGREE
98.6/ 100
METRIC RATING
101st/ 347
METRIC RANK
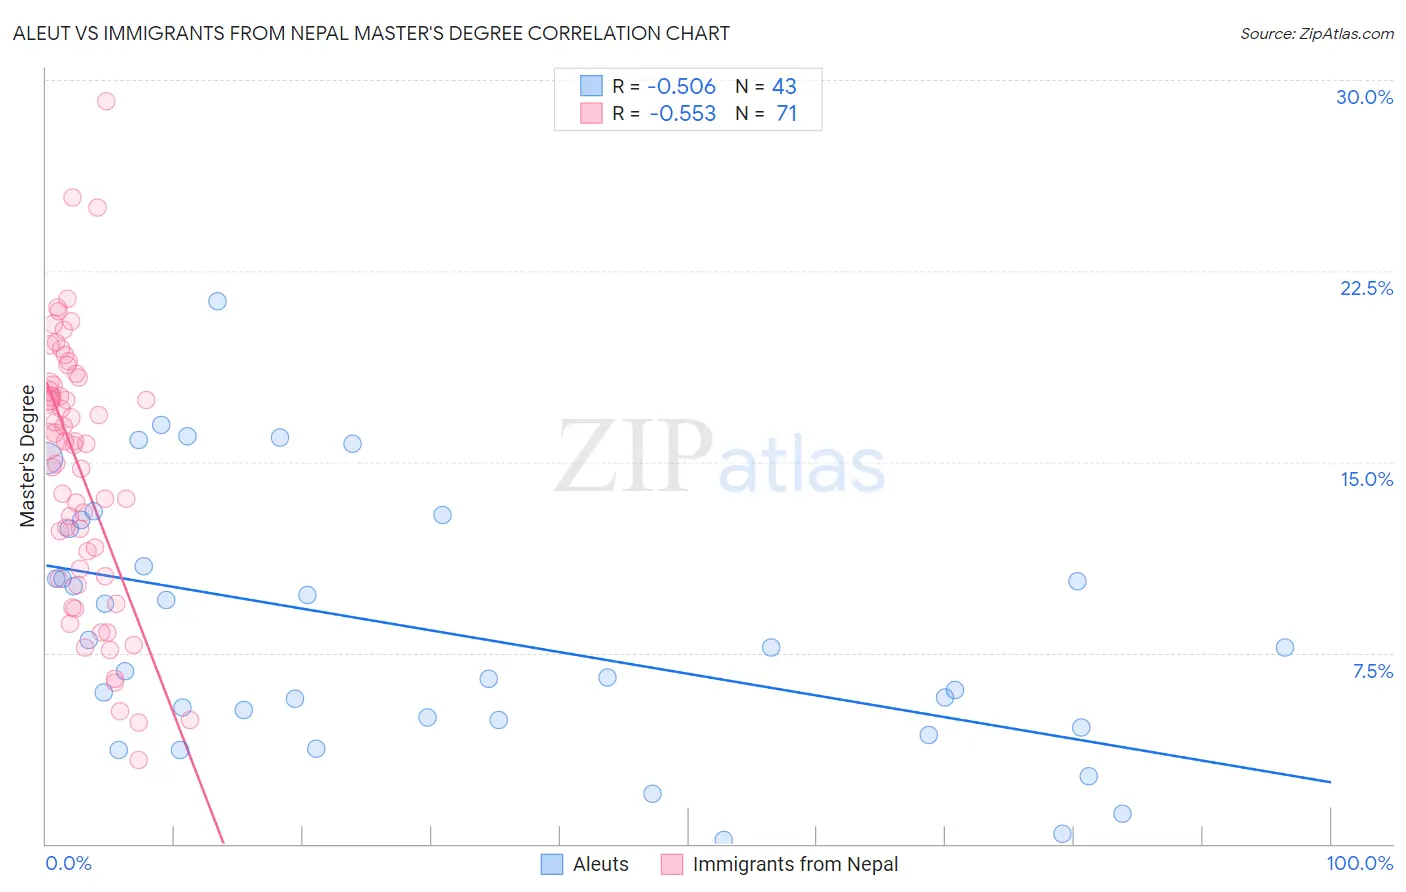
Aleut vs Immigrants from Nepal Master's Degree Correlation Chart
The statistical analysis conducted on geographies consisting of 61,771,787 people shows a substantial negative correlation between the proportion of Aleuts and percentage of population with at least master's degree education in the United States with a correlation coefficient (R) of -0.506 and weighted average of 11.8%. Similarly, the statistical analysis conducted on geographies consisting of 186,748,822 people shows a substantial negative correlation between the proportion of Immigrants from Nepal and percentage of population with at least master's degree education in the United States with a correlation coefficient (R) of -0.553 and weighted average of 17.0%, a difference of 43.7%.
Master's Degree Correlation Summary
| Measurement | Aleut | Immigrants from Nepal |
| Minimum | 0.13% | 3.3% |
| Maximum | 21.3% | 29.2% |
| Range | 21.2% | 25.9% |
| Mean | 8.4% | 14.7% |
| Median | 7.7% | 15.8% |
| Interquartile 25% (IQ1) | 4.9% | 10.5% |
| Interquartile 75% (IQ3) | 12.4% | 18.1% |
| Interquartile Range (IQR) | 7.5% | 7.6% |
| Standard Deviation (Sample) | 5.0% | 5.3% |
| Standard Deviation (Population) | 4.9% | 5.2% |
Similar Demographics by Master's Degree
Demographics Similar to Aleuts by Master's Degree
In terms of master's degree, the demographic groups most similar to Aleuts are Immigrants from Haiti (11.8%, a difference of 0.20%), Immigrants from Nicaragua (11.8%, a difference of 0.35%), Immigrants from Honduras (11.8%, a difference of 0.36%), Guatemalan (11.7%, a difference of 0.44%), and Ottawa (11.9%, a difference of 0.54%).
| Demographics | Rating | Rank | Master's Degree |
| Immigrants | Belize | 0.2 /100 | #279 | Tragic 12.1% |
| Immigrants | Dominican Republic | 0.2 /100 | #280 | Tragic 12.1% |
| Malaysians | 0.2 /100 | #281 | Tragic 12.0% |
| Immigrants | El Salvador | 0.2 /100 | #282 | Tragic 12.0% |
| Hondurans | 0.2 /100 | #283 | Tragic 11.9% |
| Ottawa | 0.2 /100 | #284 | Tragic 11.9% |
| Immigrants | Nicaragua | 0.2 /100 | #285 | Tragic 11.8% |
| Aleuts | 0.1 /100 | #286 | Tragic 11.8% |
| Immigrants | Haiti | 0.1 /100 | #287 | Tragic 11.8% |
| Immigrants | Honduras | 0.1 /100 | #288 | Tragic 11.8% |
| Guatemalans | 0.1 /100 | #289 | Tragic 11.7% |
| Ute | 0.1 /100 | #290 | Tragic 11.7% |
| Colville | 0.1 /100 | #291 | Tragic 11.6% |
| Immigrants | Guatemala | 0.1 /100 | #292 | Tragic 11.6% |
| Alaska Natives | 0.1 /100 | #293 | Tragic 11.6% |
Demographics Similar to Immigrants from Nepal by Master's Degree
In terms of master's degree, the demographic groups most similar to Immigrants from Nepal are Chilean (16.9%, a difference of 0.080%), Albanian (17.0%, a difference of 0.18%), Laotian (17.0%, a difference of 0.39%), Alsatian (16.9%, a difference of 0.41%), and Immigrants from Ukraine (17.0%, a difference of 0.45%).
| Demographics | Rating | Rank | Master's Degree |
| Ugandans | 99.0 /100 | #94 | Exceptional 17.1% |
| Immigrants | Morocco | 98.9 /100 | #95 | Exceptional 17.1% |
| Immigrants | Northern Africa | 98.9 /100 | #96 | Exceptional 17.1% |
| Immigrants | England | 98.8 /100 | #97 | Exceptional 17.0% |
| Immigrants | Ukraine | 98.8 /100 | #98 | Exceptional 17.0% |
| Laotians | 98.8 /100 | #99 | Exceptional 17.0% |
| Albanians | 98.7 /100 | #100 | Exceptional 17.0% |
| Immigrants | Nepal | 98.6 /100 | #101 | Exceptional 17.0% |
| Chileans | 98.6 /100 | #102 | Exceptional 16.9% |
| Alsatians | 98.4 /100 | #103 | Exceptional 16.9% |
| Ukrainians | 98.3 /100 | #104 | Exceptional 16.9% |
| Syrians | 98.3 /100 | #105 | Exceptional 16.8% |
| Immigrants | Albania | 98.1 /100 | #106 | Exceptional 16.8% |
| Armenians | 98.0 /100 | #107 | Exceptional 16.8% |
| Sierra Leoneans | 98.0 /100 | #108 | Exceptional 16.8% |