Taiwanese vs Immigrants from Nepal Master's Degree

COMPARE

Taiwanese
Race
Ancestry
AfghanAfricanAlaska NativeAlaskan AthabascanAlbanianAleutAlsatianAmericanApacheArabArapahoArgentineanArmenianAssyrian/Chaldean/SyriacAustralianAustrianBahamianBangladeshiBarbadianBasqueBelgianBelizeanBermudanBhutaneseBlackfeetBolivianBrazilianBritishBritish West IndianBulgarianBurmeseCajunCambodianCanadianCape VerdeanCarpatho RusynCelticCentral AmericanCentral American IndianCherokeeCheyenneChickasawChileanChineseChippewaChoctawColombianColvilleComancheCosta RicanCreeCreekCroatianCrowCubanCypriotCzechCzechoslovakianDanishDelawareDominicanDutchDutch West IndianEastern EuropeanEcuadorianEgyptianEnglishEstonianEthiopianEuropeanFijianFilipinoFinnishFrenchFrench American IndianFrench CanadianGermanGerman RussianGhanaianGreekGuamanian/ChamorroGuatemalanGuyaneseHaitianHmongHonduranHopiHoumaHungarianIcelanderIndian (Asian)IndonesianInupiatIranianIraqiIrishIroquoisIsraeliItalianJamaicanJapaneseJordanianKenyanKiowaKoreanLaotianLatvianLebaneseLiberianLithuanianLumbeeLuxembourgerMacedonianMalaysianMalteseMarshalleseMenomineeMexicanMexican American IndianMongolianMoroccanNative HawaiianNavajoNepaleseNew ZealanderNicaraguanNigerianNorthern EuropeanNorwegianOkinawanOsageOttawaPaiutePakistaniPalestinianPanamanianParaguayanPennsylvania GermanPeruvianPimaPolishPortuguesePotawatomiPuebloPuerto RicanPuget Sound SalishRomanianRussianSalvadoranSamoanScandinavianScotch-IrishScottishSeminoleSenegaleseSerbianShoshoneSierra LeoneanSiouxSlavicSlovakSloveneSomaliSouth AfricanSouth AmericanSouth American IndianSoviet UnionSpaniardSpanishSpanish AmericanSpanish American IndianSri LankanSubsaharan AfricanSudaneseSwedishSwissSyrianTaiwaneseThaiTlingit-HaidaTohono O'OdhamTonganTrinidadian and TobagonianTsimshianTurkishU.S. Virgin IslanderUgandanUkrainianUruguayanUteVenezuelanVietnameseWelshWest IndianYakamaYaquiYugoslavianYumanYup'ikZimbabwean
Immigration
NonimmigrantsImmigrantsAfghanistanAfricaAlbaniaArgentinaArmeniaAsiaAustraliaAustriaBahamasBangladeshBarbadosBelarusBelgiumBelizeBoliviaBosnia and HerzegovinaBrazilBulgariaBurma/MyanmarCabo VerdeCambodiaCameroonCanadaCaribbeanCentral AmericaChileChinaColombiaCongoCosta RicaCroatiaCubaCzechoslovakiaDenmarkDominicaDominican RepublicEastern AfricaEastern AsiaEastern EuropeEcuadorEgyptEl SalvadorEnglandEritreaEthiopiaEuropeFijiFranceGermanyGhanaGreeceGrenadaGuatemalaGuyanaHaitiHondurasHong KongHungaryIndiaIndonesiaIranIraqIrelandIsraelItalyJamaicaJapanJordanKazakhstanKenyaKoreaKuwaitLaosLatin AmericaLatviaLebanonLiberiaLithuaniaMalaysiaMexicoMicronesiaMiddle AfricaMoldovaMoroccoNetherlandsNicaraguaNigeriaNorth AmericaNorth MacedoniaNorthern AfricaNorthern EuropeNorwayOceaniaPakistanPanamaPeruPhilippinesPolandPortugalRomaniaRussiaSaudi ArabiaScotlandSenegalSerbiaSierra LeoneSingaporeSomaliaSouth AfricaSouth AmericaSouth Central AsiaSouth Eastern AsiaSouthern EuropeSpainSri LankaSt. Vincent and the GrenadinesSudanSwedenSwitzerlandSyriaTaiwanThailandTrinidad and TobagoTurkeyUgandaUkraineUruguayUzbekistanVenezuelaVietnamWest IndiesWestern AfricaWestern AsiaWestern EuropeYemenZaireZimbabweAzores
Immigrants from Nepal
Race
Ancestry
AfghanAfricanAlaska NativeAlaskan AthabascanAlbanianAleutAlsatianAmericanApacheArabArapahoArgentineanArmenianAssyrian/Chaldean/SyriacAustralianAustrianBahamianBangladeshiBarbadianBasqueBelgianBelizeanBermudanBhutaneseBlackfeetBolivianBrazilianBritishBritish West IndianBulgarianBurmeseCajunCambodianCanadianCape VerdeanCarpatho RusynCelticCentral AmericanCentral American IndianCherokeeCheyenneChickasawChileanChineseChippewaChoctawColombianColvilleComancheCosta RicanCreeCreekCroatianCrowCubanCypriotCzechCzechoslovakianDanishDelawareDominicanDutchDutch West IndianEastern EuropeanEcuadorianEgyptianEnglishEstonianEthiopianEuropeanFijianFilipinoFinnishFrenchFrench American IndianFrench CanadianGermanGerman RussianGhanaianGreekGuamanian/ChamorroGuatemalanGuyaneseHaitianHmongHonduranHopiHoumaHungarianIcelanderIndian (Asian)IndonesianInupiatIranianIraqiIrishIroquoisIsraeliItalianJamaicanJapaneseJordanianKenyanKiowaKoreanLaotianLatvianLebaneseLiberianLithuanianLumbeeLuxembourgerMacedonianMalaysianMalteseMarshalleseMenomineeMexicanMexican American IndianMongolianMoroccanNative HawaiianNavajoNepaleseNew ZealanderNicaraguanNigerianNorthern EuropeanNorwegianOkinawanOsageOttawaPaiutePakistaniPalestinianPanamanianParaguayanPennsylvania GermanPeruvianPimaPolishPortuguesePotawatomiPuebloPuerto RicanPuget Sound SalishRomanianRussianSalvadoranSamoanScandinavianScotch-IrishScottishSeminoleSenegaleseSerbianShoshoneSierra LeoneanSiouxSlavicSlovakSloveneSomaliSouth AfricanSouth AmericanSouth American IndianSoviet UnionSpaniardSpanishSpanish AmericanSpanish American IndianSri LankanSubsaharan AfricanSudaneseSwedishSwissSyrianThaiTlingit-HaidaTohono O'OdhamTonganTrinidadian and TobagonianTsimshianTurkishU.S. Virgin IslanderUgandanUkrainianUruguayanUteVenezuelanVietnameseWelshWest IndianYakamaYaquiYugoslavianYumanYup'ikZimbabwean
Immigration
NonimmigrantsImmigrantsAfghanistanAfricaAlbaniaArgentinaArmeniaAsiaAustraliaAustriaBahamasBangladeshBarbadosBelarusBelgiumBelizeBoliviaBosnia and HerzegovinaBrazilBulgariaBurma/MyanmarCabo VerdeCambodiaCameroonCanadaCaribbeanCentral AmericaChileChinaColombiaCongoCosta RicaCroatiaCubaCzechoslovakiaDenmarkDominicaDominican RepublicEastern AfricaEastern AsiaEastern EuropeEcuadorEgyptEl SalvadorEnglandEritreaEthiopiaEuropeFijiFranceGermanyGhanaGreeceGrenadaGuatemalaGuyanaHaitiHondurasHong KongHungaryIndiaIndonesiaIranIraqIrelandIsraelItalyJamaicaJapanJordanKazakhstanKenyaKoreaKuwaitLaosLatin AmericaLatviaLebanonLiberiaLithuaniaMalaysiaMexicoMicronesiaMiddle AfricaMoldovaMoroccoNepalNetherlandsNicaraguaNigeriaNorth AmericaNorth MacedoniaNorthern AfricaNorthern EuropeNorwayOceaniaPakistanPanamaPeruPhilippinesPolandPortugalRomaniaRussiaSaudi ArabiaScotlandSenegalSerbiaSierra LeoneSingaporeSomaliaSouth AfricaSouth AmericaSouth Central AsiaSouth Eastern AsiaSouthern EuropeSpainSri LankaSt. Vincent and the GrenadinesSudanSwedenSwitzerlandSyriaTaiwanThailandTrinidad and TobagoTurkeyUgandaUkraineUruguayUzbekistanVenezuelaVietnamWest IndiesWestern AfricaWestern AsiaWestern EuropeYemenZaireZimbabweAzores
Master's Degree
Income
Poverty
Unemployment
Labor Participation
Family Structure
Vehicle Availability
Education Level
Disability

Master's Degree Comparison

Taiwanese

Immigrants from Nepal

Exceptional
Exceptional
16.1%
MASTER'S DEGREE
91.9/ 100
METRIC RATING
131st/ 347
METRIC RANK
17.0%
MASTER'S DEGREE
98.6/ 100
METRIC RATING
101st/ 347
METRIC RANK

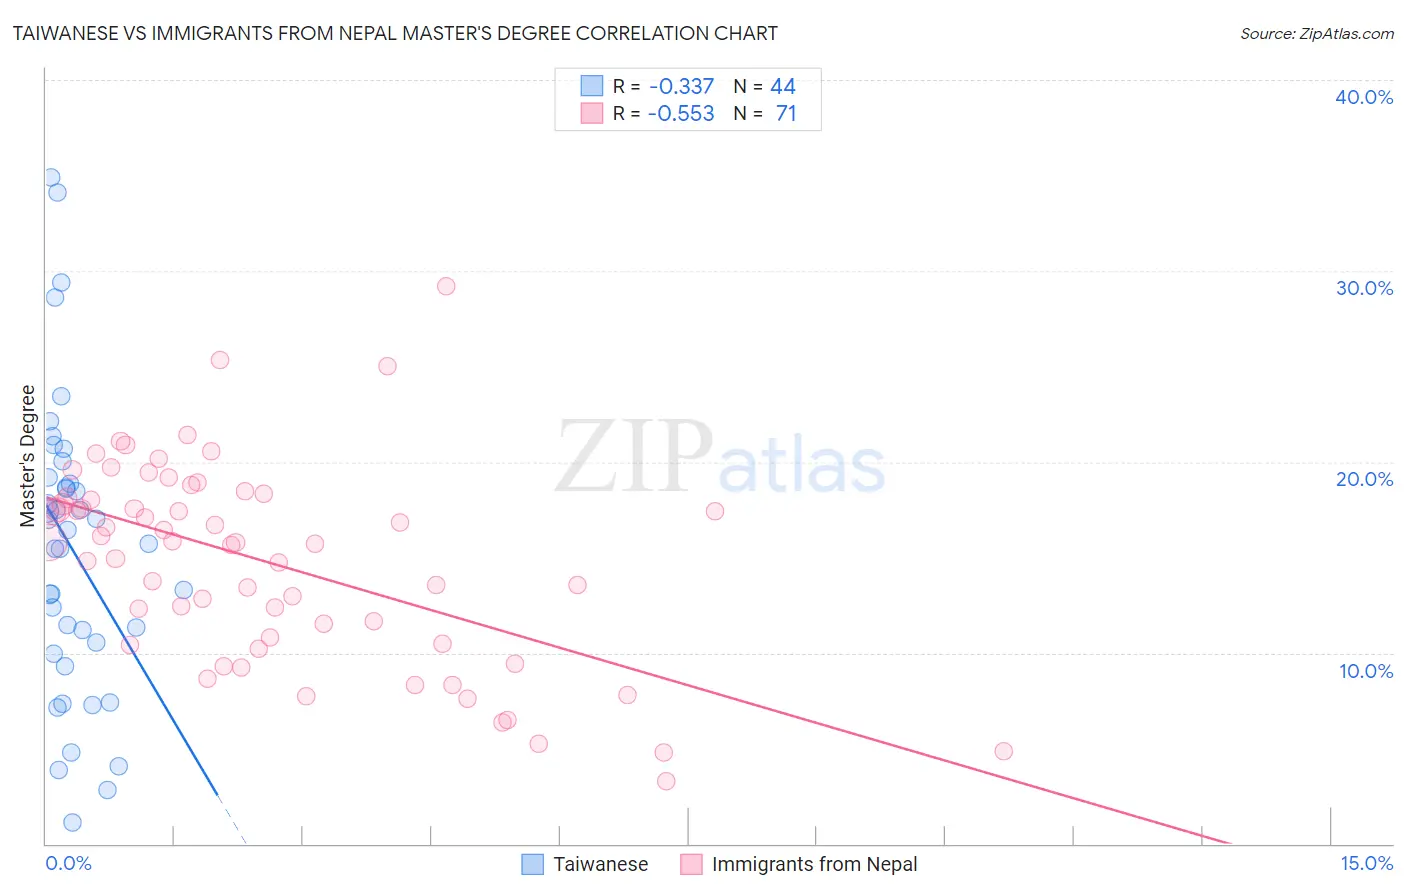
Taiwanese vs Immigrants from Nepal Master's Degree Correlation Chart

The statistical analysis conducted on geographies consisting of 31,724,936 people shows a mild negative correlation between the proportion of Taiwanese and percentage of population with at least master's degree education in the United States with a correlation coefficient (R) of -0.337 and weighted average of 16.1%. Similarly, the statistical analysis conducted on geographies consisting of 186,748,822 people shows a substantial negative correlation between the proportion of Immigrants from Nepal and percentage of population with at least master's degree education in the United States with a correlation coefficient (R) of -0.553 and weighted average of 17.0%, a difference of 5.4%.
Taiwanese vs Immigrants from Nepal Master's Degree

Master's Degree Correlation Summary

MeasurementTaiwaneseImmigrants from Nepal
Minimum1.1%3.3%
Maximum34.9%29.2%
Range33.8%25.9%
Mean15.4%14.7%
Median16.1%15.8%
Interquartile 25% (IQ1)10.2%10.5%
Interquartile 75% (IQ3)19.0%18.1%
Interquartile Range (IQR)8.8%7.6%
Standard Deviation (Sample)7.7%5.3%
Standard Deviation (Population)7.6%5.2%

Similar Demographics by Master's Degree

Demographics Similar to Taiwanese by Master's Degree

In terms of master's degree, the demographic groups most similar to Taiwanese are Serbian (16.1%, a difference of 0.090%), Immigrants from Jordan (16.1%, a difference of 0.32%), Immigrants from Syria (16.2%, a difference of 0.58%), Immigrants from Sudan (16.0%, a difference of 0.63%), and Venezuelan (15.9%, a difference of 1.2%).
DemographicsRating | RankMaster's Degree
Immigrants | Eritrea
95.5
/100
|
#124
Exceptional
16.4%
Italians
95.4
/100
|
#125
Exceptional
16.4%
Immigrants | Eastern Africa
95.2
/100
|
#126
Exceptional
16.3%
Palestinians
94.8
/100
|
#127
Exceptional
16.3%
Immigrants | Sierra Leone
94.7
/100
|
#128
Exceptional
16.3%
Immigrants | Syria
93.3
/100
|
#129
Exceptional
16.2%
Immigrants | Jordan
92.7
/100
|
#130
Exceptional
16.1%
Taiwanese
91.9
/100
|
#131
Exceptional
16.1%
Serbians
91.7
/100
|
#132
Exceptional
16.1%
Immigrants | Sudan
90.2
/100
|
#133
Exceptional
16.0%
Venezuelans
88.4
/100
|
#134
Excellent
15.9%
South American Indians
88.4
/100
|
#135
Excellent
15.9%
Assyrians/Chaldeans/Syriacs
86.8
/100
|
#136
Excellent
15.8%
Europeans
86.4
/100
|
#137
Excellent
15.8%
Pakistanis
86.1
/100
|
#138
Excellent
15.8%

Demographics Similar to Immigrants from Nepal by Master's Degree

In terms of master's degree, the demographic groups most similar to Immigrants from Nepal are Chilean (16.9%, a difference of 0.080%), Albanian (17.0%, a difference of 0.18%), Laotian (17.0%, a difference of 0.39%), Alsatian (16.9%, a difference of 0.41%), and Immigrants from Ukraine (17.0%, a difference of 0.45%).
DemographicsRating | RankMaster's Degree
Ugandans
99.0
/100
|
#94
Exceptional
17.1%
Immigrants | Morocco
98.9
/100
|
#95
Exceptional
17.1%
Immigrants | Northern Africa
98.9
/100
|
#96
Exceptional
17.1%
Immigrants | England
98.8
/100
|
#97
Exceptional
17.0%
Immigrants | Ukraine
98.8
/100
|
#98
Exceptional
17.0%
Laotians
98.8
/100
|
#99
Exceptional
17.0%
Albanians
98.7
/100
|
#100
Exceptional
17.0%
Immigrants | Nepal
98.6
/100
|
#101
Exceptional
17.0%
Chileans
98.6
/100
|
#102
Exceptional
16.9%
Alsatians
98.4
/100
|
#103
Exceptional
16.9%
Ukrainians
98.3
/100
|
#104
Exceptional
16.9%
Syrians
98.3
/100
|
#105
Exceptional
16.8%
Immigrants | Albania
98.1
/100
|
#106
Exceptional
16.8%
Armenians
98.0
/100
|
#107
Exceptional
16.8%
Sierra Leoneans
98.0
/100
|
#108
Exceptional
16.8%