Peruvian vs Immigrants from Zaire Master's Degree
COMPARE
Peruvian
Immigrants from Zaire
Master's Degree
Master's Degree Comparison
Peruvians
Immigrants from Zaire
15.3%
MASTER'S DEGREE
68.7/ 100
METRIC RATING
162nd/ 347
METRIC RANK
14.7%
MASTER'S DEGREE
39.5/ 100
METRIC RATING
184th/ 347
METRIC RANK
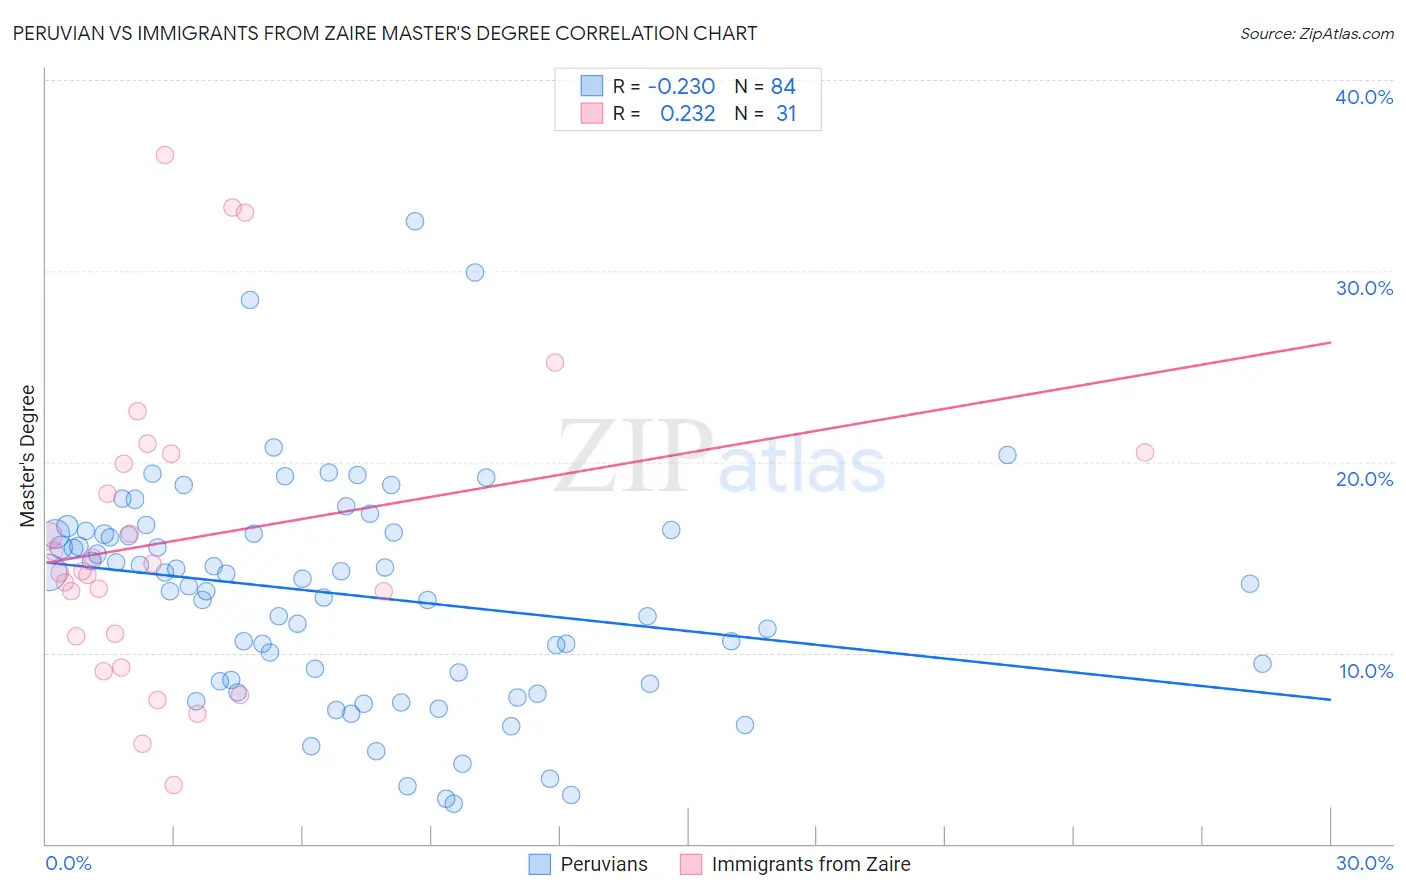
Peruvian vs Immigrants from Zaire Master's Degree Correlation Chart
The statistical analysis conducted on geographies consisting of 363,142,286 people shows a weak negative correlation between the proportion of Peruvians and percentage of population with at least master's degree education in the United States with a correlation coefficient (R) of -0.230 and weighted average of 15.3%. Similarly, the statistical analysis conducted on geographies consisting of 107,246,977 people shows a weak positive correlation between the proportion of Immigrants from Zaire and percentage of population with at least master's degree education in the United States with a correlation coefficient (R) of 0.232 and weighted average of 14.7%, a difference of 3.9%.
Master's Degree Correlation Summary
| Measurement | Peruvian | Immigrants from Zaire |
| Minimum | 2.1% | 3.1% |
| Maximum | 32.6% | 36.1% |
| Range | 30.5% | 33.0% |
| Mean | 13.1% | 15.9% |
| Median | 13.8% | 14.3% |
| Interquartile 25% (IQ1) | 8.6% | 10.9% |
| Interquartile 75% (IQ3) | 16.3% | 20.4% |
| Interquartile Range (IQR) | 7.7% | 9.6% |
| Standard Deviation (Sample) | 5.8% | 8.0% |
| Standard Deviation (Population) | 5.8% | 7.8% |
Similar Demographics by Master's Degree
Demographics Similar to Peruvians by Master's Degree
In terms of master's degree, the demographic groups most similar to Peruvians are Sudanese (15.3%, a difference of 0.010%), Uruguayan (15.3%, a difference of 0.22%), Kenyan (15.3%, a difference of 0.24%), Colombian (15.3%, a difference of 0.25%), and Immigrants from Kenya (15.3%, a difference of 0.29%).
| Demographics | Rating | Rank | Master's Degree |
| Immigrants | Bangladesh | 76.1 /100 | #155 | Good 15.5% |
| Bermudans | 73.9 /100 | #156 | Good 15.4% |
| Immigrants | Cameroon | 71.7 /100 | #157 | Good 15.4% |
| Immigrants | Poland | 71.5 /100 | #158 | Good 15.4% |
| Luxembourgers | 71.0 /100 | #159 | Good 15.3% |
| Kenyans | 70.3 /100 | #160 | Good 15.3% |
| Sudanese | 68.7 /100 | #161 | Good 15.3% |
| Peruvians | 68.7 /100 | #162 | Good 15.3% |
| Uruguayans | 67.1 /100 | #163 | Good 15.3% |
| Colombians | 66.9 /100 | #164 | Good 15.3% |
| Immigrants | Kenya | 66.6 /100 | #165 | Good 15.3% |
| Swedes | 66.1 /100 | #166 | Good 15.2% |
| Senegalese | 65.6 /100 | #167 | Good 15.2% |
| Immigrants | North Macedonia | 64.5 /100 | #168 | Good 15.2% |
| Scottish | 62.7 /100 | #169 | Good 15.2% |
Demographics Similar to Immigrants from Zaire by Master's Degree
In terms of master's degree, the demographic groups most similar to Immigrants from Zaire are Sri Lankan (14.7%, a difference of 0.020%), Czech (14.7%, a difference of 0.12%), Barbadian (14.7%, a difference of 0.16%), Swiss (14.7%, a difference of 0.22%), and Immigrants from Iraq (14.8%, a difference of 0.25%).
| Demographics | Rating | Rank | Master's Degree |
| Immigrants | Colombia | 48.3 /100 | #177 | Average 14.9% |
| English | 45.0 /100 | #178 | Average 14.8% |
| Immigrants | Iraq | 41.3 /100 | #179 | Average 14.8% |
| Celtics | 41.3 /100 | #180 | Average 14.8% |
| Swiss | 41.1 /100 | #181 | Average 14.7% |
| Czechs | 40.4 /100 | #182 | Average 14.7% |
| Sri Lankans | 39.6 /100 | #183 | Fair 14.7% |
| Immigrants | Zaire | 39.5 /100 | #184 | Fair 14.7% |
| Barbadians | 38.3 /100 | #185 | Fair 14.7% |
| Immigrants | Oceania | 37.1 /100 | #186 | Fair 14.7% |
| Basques | 36.5 /100 | #187 | Fair 14.7% |
| Immigrants | Costa Rica | 36.2 /100 | #188 | Fair 14.7% |
| Immigrants | Immigrants | 36.0 /100 | #189 | Fair 14.6% |
| Spaniards | 35.8 /100 | #190 | Fair 14.6% |
| Welsh | 34.2 /100 | #191 | Fair 14.6% |