Immigrants from China vs Immigrants from Nepal Master's Degree
COMPARE
Immigrants from China
Immigrants from Nepal
Master's Degree
Master's Degree Comparison
Immigrants from China
Immigrants from Nepal
21.2%
MASTER'S DEGREE
100.0/ 100
METRIC RATING
11th/ 347
METRIC RANK
17.0%
MASTER'S DEGREE
98.6/ 100
METRIC RATING
101st/ 347
METRIC RANK
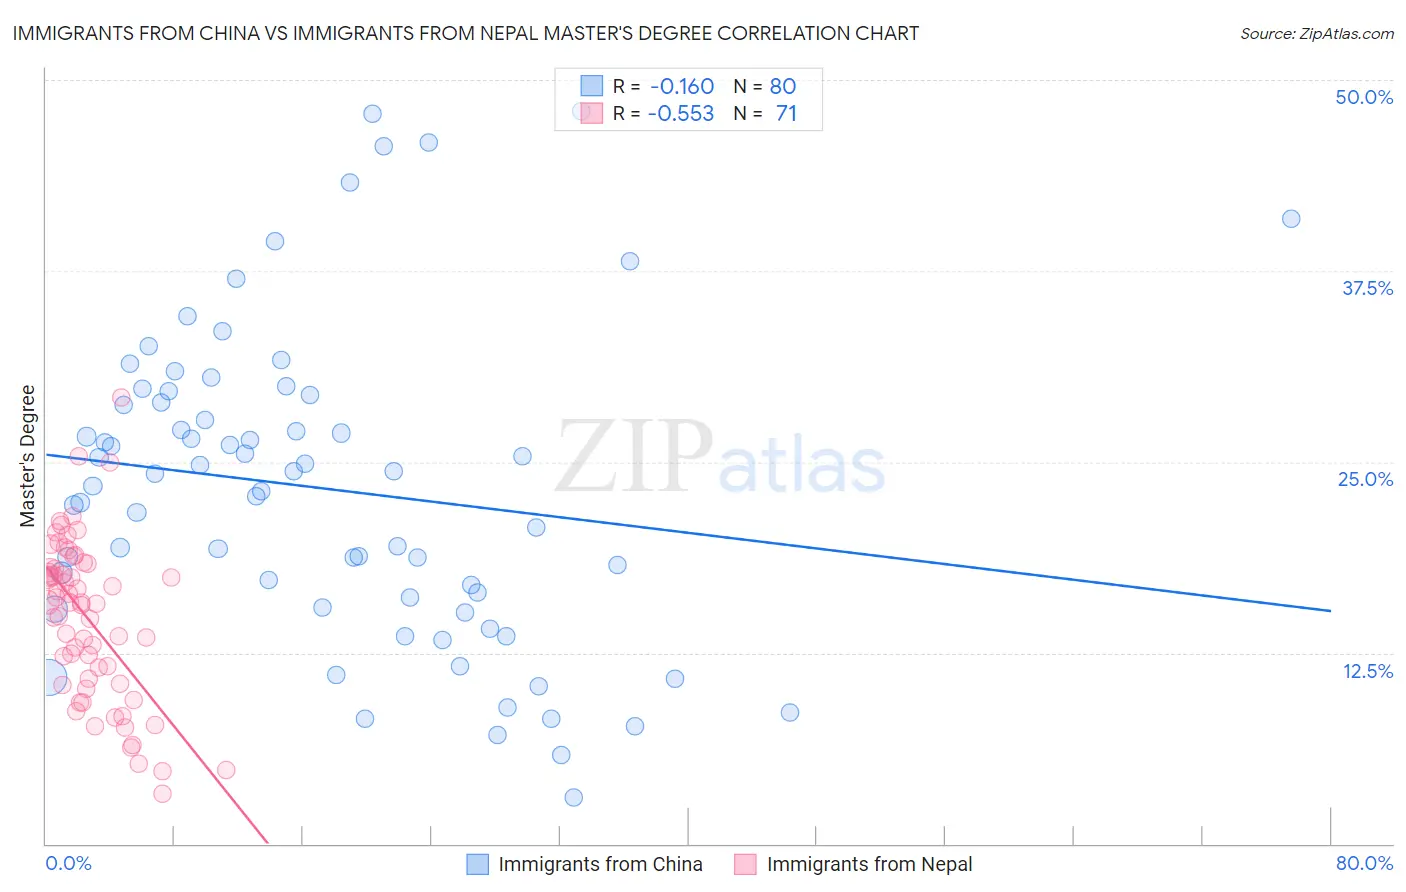
Immigrants from China vs Immigrants from Nepal Master's Degree Correlation Chart
The statistical analysis conducted on geographies consisting of 456,812,214 people shows a poor negative correlation between the proportion of Immigrants from China and percentage of population with at least master's degree education in the United States with a correlation coefficient (R) of -0.160 and weighted average of 21.2%. Similarly, the statistical analysis conducted on geographies consisting of 186,748,822 people shows a substantial negative correlation between the proportion of Immigrants from Nepal and percentage of population with at least master's degree education in the United States with a correlation coefficient (R) of -0.553 and weighted average of 17.0%, a difference of 24.9%.
Master's Degree Correlation Summary
| Measurement | Immigrants from China | Immigrants from Nepal |
| Minimum | 3.0% | 3.3% |
| Maximum | 48.0% | 29.2% |
| Range | 44.9% | 25.9% |
| Mean | 23.2% | 14.7% |
| Median | 23.8% | 15.8% |
| Interquartile 25% (IQ1) | 15.8% | 10.5% |
| Interquartile 75% (IQ3) | 29.1% | 18.1% |
| Interquartile Range (IQR) | 13.3% | 7.6% |
| Standard Deviation (Sample) | 10.3% | 5.3% |
| Standard Deviation (Population) | 10.2% | 5.2% |
Similar Demographics by Master's Degree
Demographics Similar to Immigrants from China by Master's Degree
In terms of master's degree, the demographic groups most similar to Immigrants from China are Eastern European (21.1%, a difference of 0.32%), Immigrants from Australia (20.9%, a difference of 1.5%), Immigrants from Switzerland (20.9%, a difference of 1.5%), Immigrants from Eastern Asia (20.8%, a difference of 1.7%), and Immigrants from Belgium (20.8%, a difference of 2.0%).
| Demographics | Rating | Rank | Master's Degree |
| Okinawans | 100.0 /100 | #4 | Exceptional 22.6% |
| Immigrants | Taiwan | 100.0 /100 | #5 | Exceptional 22.5% |
| Immigrants | India | 100.0 /100 | #6 | Exceptional 22.3% |
| Iranians | 100.0 /100 | #7 | Exceptional 22.3% |
| Cypriots | 100.0 /100 | #8 | Exceptional 21.8% |
| Thais | 100.0 /100 | #9 | Exceptional 21.7% |
| Immigrants | Iran | 100.0 /100 | #10 | Exceptional 21.6% |
| Immigrants | China | 100.0 /100 | #11 | Exceptional 21.2% |
| Eastern Europeans | 100.0 /100 | #12 | Exceptional 21.1% |
| Immigrants | Australia | 100.0 /100 | #13 | Exceptional 20.9% |
| Immigrants | Switzerland | 100.0 /100 | #14 | Exceptional 20.9% |
| Immigrants | Eastern Asia | 100.0 /100 | #15 | Exceptional 20.8% |
| Immigrants | Belgium | 100.0 /100 | #16 | Exceptional 20.8% |
| Immigrants | South Central Asia | 100.0 /100 | #17 | Exceptional 20.7% |
| Soviet Union | 100.0 /100 | #18 | Exceptional 20.5% |
Demographics Similar to Immigrants from Nepal by Master's Degree
In terms of master's degree, the demographic groups most similar to Immigrants from Nepal are Chilean (16.9%, a difference of 0.080%), Albanian (17.0%, a difference of 0.18%), Laotian (17.0%, a difference of 0.39%), Alsatian (16.9%, a difference of 0.41%), and Immigrants from Ukraine (17.0%, a difference of 0.45%).
| Demographics | Rating | Rank | Master's Degree |
| Ugandans | 99.0 /100 | #94 | Exceptional 17.1% |
| Immigrants | Morocco | 98.9 /100 | #95 | Exceptional 17.1% |
| Immigrants | Northern Africa | 98.9 /100 | #96 | Exceptional 17.1% |
| Immigrants | England | 98.8 /100 | #97 | Exceptional 17.0% |
| Immigrants | Ukraine | 98.8 /100 | #98 | Exceptional 17.0% |
| Laotians | 98.8 /100 | #99 | Exceptional 17.0% |
| Albanians | 98.7 /100 | #100 | Exceptional 17.0% |
| Immigrants | Nepal | 98.6 /100 | #101 | Exceptional 17.0% |
| Chileans | 98.6 /100 | #102 | Exceptional 16.9% |
| Alsatians | 98.4 /100 | #103 | Exceptional 16.9% |
| Ukrainians | 98.3 /100 | #104 | Exceptional 16.9% |
| Syrians | 98.3 /100 | #105 | Exceptional 16.8% |
| Immigrants | Albania | 98.1 /100 | #106 | Exceptional 16.8% |
| Armenians | 98.0 /100 | #107 | Exceptional 16.8% |
| Sierra Leoneans | 98.0 /100 | #108 | Exceptional 16.8% |