Immigrants from Poland vs Immigrants from Nepal College, Under 1 year
COMPARE
Immigrants from Poland
Immigrants from Nepal
College, Under 1 year
College, Under 1 year Comparison
Immigrants from Poland
Immigrants from Nepal
65.2%
COLLEGE, UNDER 1 YEAR
42.6/ 100
METRIC RATING
183rd/ 347
METRIC RANK
67.5%
COLLEGE, UNDER 1 YEAR
94.9/ 100
METRIC RATING
116th/ 347
METRIC RANK
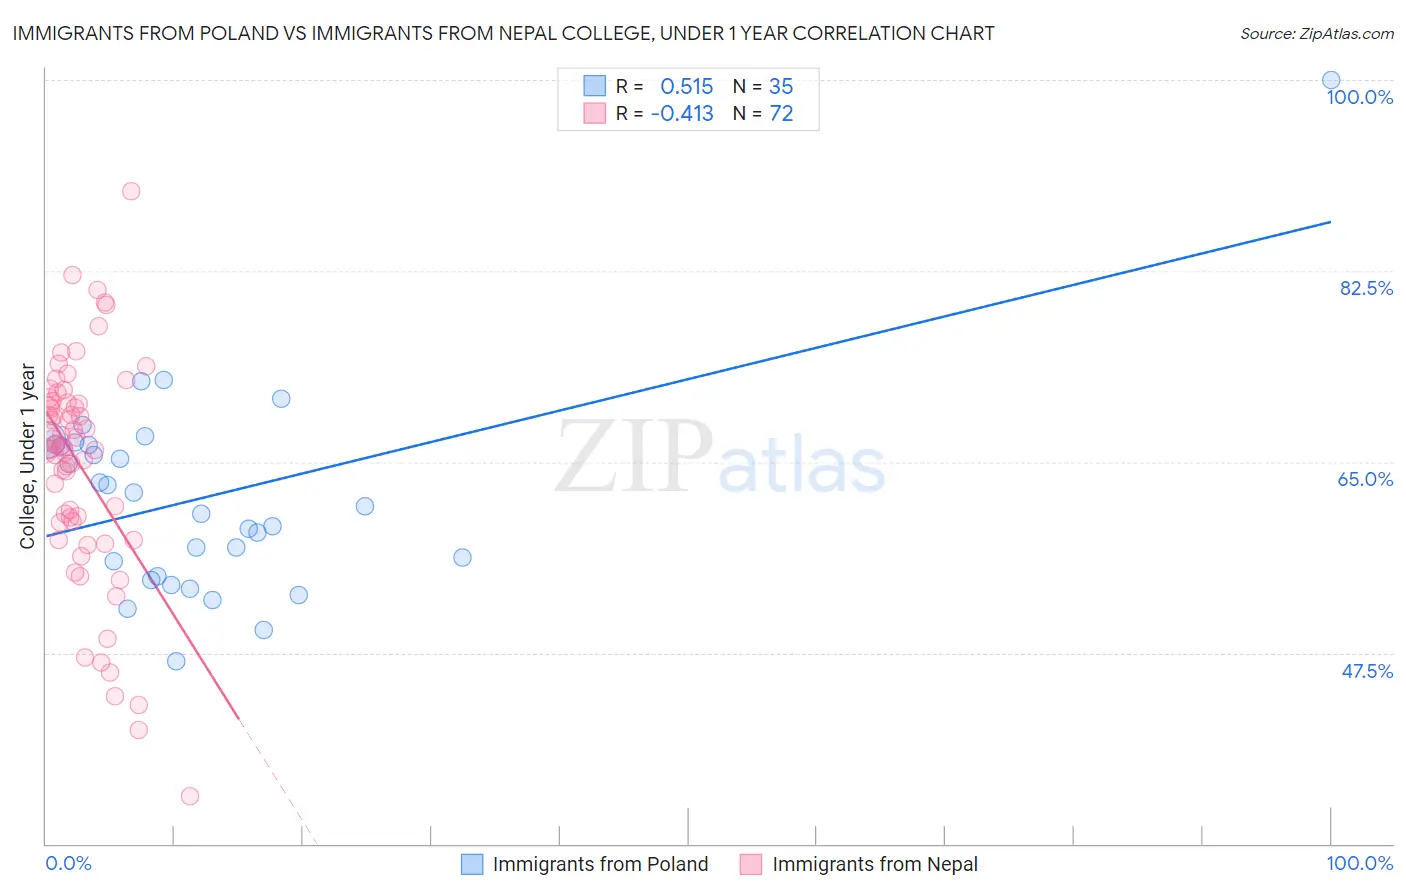
Immigrants from Poland vs Immigrants from Nepal College, Under 1 year Correlation Chart
The statistical analysis conducted on geographies consisting of 304,861,877 people shows a substantial positive correlation between the proportion of Immigrants from Poland and percentage of population with at least college, under 1 year education in the United States with a correlation coefficient (R) of 0.515 and weighted average of 65.2%. Similarly, the statistical analysis conducted on geographies consisting of 186,775,596 people shows a moderate negative correlation between the proportion of Immigrants from Nepal and percentage of population with at least college, under 1 year education in the United States with a correlation coefficient (R) of -0.413 and weighted average of 67.5%, a difference of 3.5%.
College, Under 1 year Correlation Summary
| Measurement | Immigrants from Poland | Immigrants from Nepal |
| Minimum | 46.7% | 34.4% |
| Maximum | 100.0% | 89.8% |
| Range | 53.3% | 55.5% |
| Mean | 61.8% | 64.6% |
| Median | 61.0% | 66.3% |
| Interquartile 25% (IQ1) | 54.6% | 59.5% |
| Interquartile 75% (IQ3) | 66.6% | 70.5% |
| Interquartile Range (IQR) | 12.0% | 11.0% |
| Standard Deviation (Sample) | 9.4% | 10.3% |
| Standard Deviation (Population) | 9.3% | 10.2% |
Similar Demographics by College, Under 1 year
Demographics Similar to Immigrants from Poland by College, Under 1 year
In terms of college, under 1 year, the demographic groups most similar to Immigrants from Poland are Bermudan (65.2%, a difference of 0.030%), Sri Lankan (65.2%, a difference of 0.040%), Immigrants from Africa (65.3%, a difference of 0.10%), Spaniard (65.3%, a difference of 0.13%), and Immigrants from Sierra Leone (65.1%, a difference of 0.13%).
| Demographics | Rating | Rank | College, Under 1 year |
| French | 48.9 /100 | #176 | Average 65.4% |
| Immigrants | North Macedonia | 48.6 /100 | #177 | Average 65.4% |
| German Russians | 48.3 /100 | #178 | Average 65.4% |
| Guamanians/Chamorros | 48.2 /100 | #179 | Average 65.4% |
| Dutch | 46.1 /100 | #180 | Average 65.3% |
| Spaniards | 45.5 /100 | #181 | Average 65.3% |
| Immigrants | Africa | 44.7 /100 | #182 | Average 65.3% |
| Immigrants | Poland | 42.6 /100 | #183 | Average 65.2% |
| Bermudans | 42.0 /100 | #184 | Average 65.2% |
| Sri Lankans | 41.7 /100 | #185 | Average 65.2% |
| Immigrants | Sierra Leone | 39.7 /100 | #186 | Fair 65.1% |
| Immigrants | Southern Europe | 34.3 /100 | #187 | Fair 64.9% |
| Immigrants | Albania | 32.0 /100 | #188 | Fair 64.9% |
| Spanish | 31.6 /100 | #189 | Fair 64.9% |
| Immigrants | Philippines | 30.1 /100 | #190 | Fair 64.8% |
Demographics Similar to Immigrants from Nepal by College, Under 1 year
In terms of college, under 1 year, the demographic groups most similar to Immigrants from Nepal are Pakistani (67.5%, a difference of 0.020%), Immigrants from Ukraine (67.5%, a difference of 0.040%), Lebanese (67.5%, a difference of 0.060%), Basque (67.6%, a difference of 0.080%), and Chilean (67.6%, a difference of 0.090%).
| Demographics | Rating | Rank | College, Under 1 year |
| Scandinavians | 95.8 /100 | #109 | Exceptional 67.7% |
| Assyrians/Chaldeans/Syriacs | 95.8 /100 | #110 | Exceptional 67.7% |
| Ukrainians | 95.8 /100 | #111 | Exceptional 67.7% |
| Macedonians | 95.7 /100 | #112 | Exceptional 67.6% |
| Syrians | 95.6 /100 | #113 | Exceptional 67.6% |
| Chileans | 95.3 /100 | #114 | Exceptional 67.6% |
| Basques | 95.2 /100 | #115 | Exceptional 67.6% |
| Immigrants | Nepal | 94.9 /100 | #116 | Exceptional 67.5% |
| Pakistanis | 94.8 /100 | #117 | Exceptional 67.5% |
| Immigrants | Ukraine | 94.7 /100 | #118 | Exceptional 67.5% |
| Lebanese | 94.6 /100 | #119 | Exceptional 67.5% |
| Serbians | 93.9 /100 | #120 | Exceptional 67.4% |
| Slovenes | 93.3 /100 | #121 | Exceptional 67.3% |
| Immigrants | Jordan | 92.8 /100 | #122 | Exceptional 67.3% |
| Immigrants | Northern Africa | 92.7 /100 | #123 | Exceptional 67.2% |