Israeli vs Immigrants from Nepal College, Under 1 year
COMPARE
Israeli
Immigrants from Nepal
College, Under 1 year
College, Under 1 year Comparison
Israelis
Immigrants from Nepal
70.2%
COLLEGE, UNDER 1 YEAR
99.9/ 100
METRIC RATING
43rd/ 347
METRIC RANK
67.5%
COLLEGE, UNDER 1 YEAR
94.9/ 100
METRIC RATING
116th/ 347
METRIC RANK
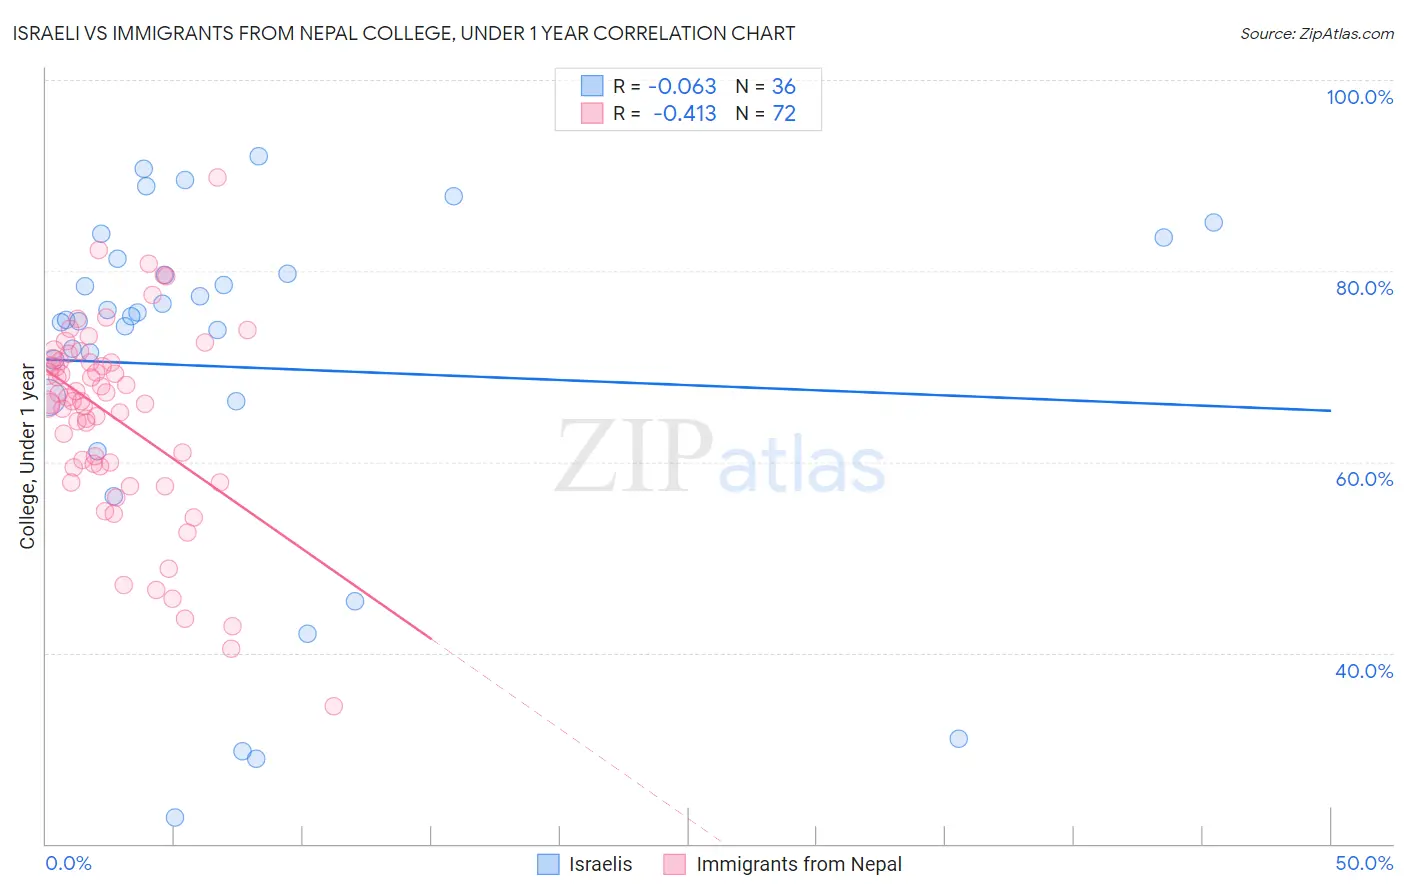
Israeli vs Immigrants from Nepal College, Under 1 year Correlation Chart
The statistical analysis conducted on geographies consisting of 211,218,479 people shows a slight negative correlation between the proportion of Israelis and percentage of population with at least college, under 1 year education in the United States with a correlation coefficient (R) of -0.063 and weighted average of 70.2%. Similarly, the statistical analysis conducted on geographies consisting of 186,775,596 people shows a moderate negative correlation between the proportion of Immigrants from Nepal and percentage of population with at least college, under 1 year education in the United States with a correlation coefficient (R) of -0.413 and weighted average of 67.5%, a difference of 4.0%.
College, Under 1 year Correlation Summary
| Measurement | Israeli | Immigrants from Nepal |
| Minimum | 22.7% | 34.4% |
| Maximum | 92.0% | 89.8% |
| Range | 69.3% | 55.5% |
| Mean | 69.9% | 64.6% |
| Median | 75.0% | 66.3% |
| Interquartile 25% (IQ1) | 66.5% | 59.5% |
| Interquartile 75% (IQ3) | 80.5% | 70.5% |
| Interquartile Range (IQR) | 14.0% | 11.0% |
| Standard Deviation (Sample) | 18.6% | 10.3% |
| Standard Deviation (Population) | 18.3% | 10.2% |
Similar Demographics by College, Under 1 year
Demographics Similar to Israelis by College, Under 1 year
In terms of college, under 1 year, the demographic groups most similar to Israelis are New Zealander (70.2%, a difference of 0.0%), Immigrants from Norway (70.2%, a difference of 0.020%), Immigrants from Lithuania (70.3%, a difference of 0.070%), Immigrants from Kuwait (70.3%, a difference of 0.11%), and Immigrants from Latvia (70.1%, a difference of 0.14%).
| Demographics | Rating | Rank | College, Under 1 year |
| Immigrants | Sri Lanka | 99.9 /100 | #36 | Exceptional 70.5% |
| Immigrants | Saudi Arabia | 99.9 /100 | #37 | Exceptional 70.4% |
| Australians | 99.9 /100 | #38 | Exceptional 70.4% |
| Bhutanese | 99.9 /100 | #39 | Exceptional 70.3% |
| Immigrants | Turkey | 99.9 /100 | #40 | Exceptional 70.3% |
| Immigrants | Kuwait | 99.9 /100 | #41 | Exceptional 70.3% |
| Immigrants | Lithuania | 99.9 /100 | #42 | Exceptional 70.3% |
| Israelis | 99.9 /100 | #43 | Exceptional 70.2% |
| New Zealanders | 99.9 /100 | #44 | Exceptional 70.2% |
| Immigrants | Norway | 99.9 /100 | #45 | Exceptional 70.2% |
| Immigrants | Latvia | 99.9 /100 | #46 | Exceptional 70.1% |
| Immigrants | Bulgaria | 99.8 /100 | #47 | Exceptional 70.0% |
| Immigrants | Netherlands | 99.8 /100 | #48 | Exceptional 70.0% |
| Immigrants | Austria | 99.8 /100 | #49 | Exceptional 70.0% |
| Zimbabweans | 99.8 /100 | #50 | Exceptional 69.9% |
Demographics Similar to Immigrants from Nepal by College, Under 1 year
In terms of college, under 1 year, the demographic groups most similar to Immigrants from Nepal are Pakistani (67.5%, a difference of 0.020%), Immigrants from Ukraine (67.5%, a difference of 0.040%), Lebanese (67.5%, a difference of 0.060%), Basque (67.6%, a difference of 0.080%), and Chilean (67.6%, a difference of 0.090%).
| Demographics | Rating | Rank | College, Under 1 year |
| Scandinavians | 95.8 /100 | #109 | Exceptional 67.7% |
| Assyrians/Chaldeans/Syriacs | 95.8 /100 | #110 | Exceptional 67.7% |
| Ukrainians | 95.8 /100 | #111 | Exceptional 67.7% |
| Macedonians | 95.7 /100 | #112 | Exceptional 67.6% |
| Syrians | 95.6 /100 | #113 | Exceptional 67.6% |
| Chileans | 95.3 /100 | #114 | Exceptional 67.6% |
| Basques | 95.2 /100 | #115 | Exceptional 67.6% |
| Immigrants | Nepal | 94.9 /100 | #116 | Exceptional 67.5% |
| Pakistanis | 94.8 /100 | #117 | Exceptional 67.5% |
| Immigrants | Ukraine | 94.7 /100 | #118 | Exceptional 67.5% |
| Lebanese | 94.6 /100 | #119 | Exceptional 67.5% |
| Serbians | 93.9 /100 | #120 | Exceptional 67.4% |
| Slovenes | 93.3 /100 | #121 | Exceptional 67.3% |
| Immigrants | Jordan | 92.8 /100 | #122 | Exceptional 67.3% |
| Immigrants | Northern Africa | 92.7 /100 | #123 | Exceptional 67.2% |