Panamanian vs Immigrants from Germany Associate's Degree
COMPARE
Panamanian
Immigrants from Germany
Associate's Degree
Associate's Degree Comparison
Panamanians
Immigrants from Germany
45.1%
ASSOCIATE'S DEGREE
18.4/ 100
METRIC RATING
207th/ 347
METRIC RANK
47.1%
ASSOCIATE'S DEGREE
69.7/ 100
METRIC RATING
158th/ 347
METRIC RANK
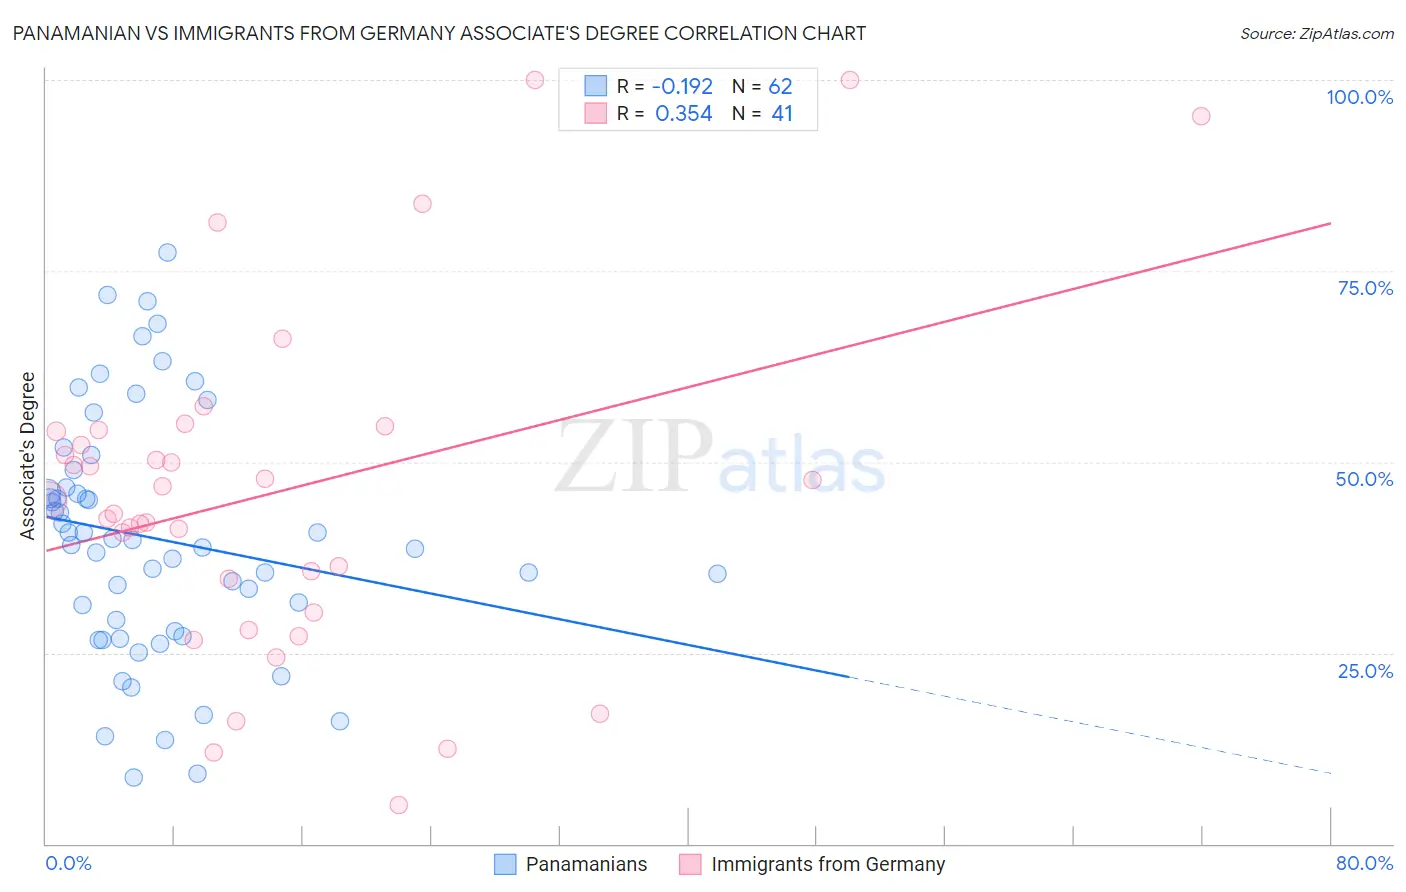
Panamanian vs Immigrants from Germany Associate's Degree Correlation Chart
The statistical analysis conducted on geographies consisting of 281,234,684 people shows a poor negative correlation between the proportion of Panamanians and percentage of population with at least associate's degree education in the United States with a correlation coefficient (R) of -0.192 and weighted average of 45.1%. Similarly, the statistical analysis conducted on geographies consisting of 463,874,369 people shows a mild positive correlation between the proportion of Immigrants from Germany and percentage of population with at least associate's degree education in the United States with a correlation coefficient (R) of 0.354 and weighted average of 47.1%, a difference of 4.5%.
Associate's Degree Correlation Summary
| Measurement | Panamanian | Immigrants from Germany |
| Minimum | 8.6% | 5.1% |
| Maximum | 77.4% | 100.0% |
| Range | 68.8% | 94.9% |
| Mean | 39.9% | 46.1% |
| Median | 39.4% | 44.9% |
| Interquartile 25% (IQ1) | 27.9% | 32.5% |
| Interquartile 75% (IQ3) | 46.6% | 54.1% |
| Interquartile Range (IQR) | 18.7% | 21.6% |
| Standard Deviation (Sample) | 15.9% | 22.2% |
| Standard Deviation (Population) | 15.8% | 22.0% |
Similar Demographics by Associate's Degree
Demographics Similar to Panamanians by Associate's Degree
In terms of associate's degree, the demographic groups most similar to Panamanians are Immigrants from Thailand (45.1%, a difference of 0.070%), German Russian (45.1%, a difference of 0.070%), Nigerian (45.1%, a difference of 0.090%), Dutch (45.0%, a difference of 0.10%), and Immigrants from Costa Rica (45.0%, a difference of 0.22%).
| Demographics | Rating | Rank | Associate's Degree |
| Senegalese | 21.1 /100 | #200 | Fair 45.2% |
| Immigrants | Vietnam | 20.8 /100 | #201 | Fair 45.2% |
| Spaniards | 20.4 /100 | #202 | Fair 45.2% |
| Immigrants | South Eastern Asia | 20.2 /100 | #203 | Fair 45.2% |
| Nigerians | 19.1 /100 | #204 | Poor 45.1% |
| Immigrants | Thailand | 18.9 /100 | #205 | Poor 45.1% |
| German Russians | 18.9 /100 | #206 | Poor 45.1% |
| Panamanians | 18.4 /100 | #207 | Poor 45.1% |
| Dutch | 17.6 /100 | #208 | Poor 45.0% |
| Immigrants | Costa Rica | 16.7 /100 | #209 | Poor 45.0% |
| Immigrants | Philippines | 16.7 /100 | #210 | Poor 45.0% |
| Immigrants | Zaire | 16.6 /100 | #211 | Poor 45.0% |
| French Canadians | 15.0 /100 | #212 | Poor 44.9% |
| Immigrants | Ghana | 14.2 /100 | #213 | Poor 44.8% |
| Immigrants | Middle Africa | 12.7 /100 | #214 | Poor 44.7% |
Demographics Similar to Immigrants from Germany by Associate's Degree
In terms of associate's degree, the demographic groups most similar to Immigrants from Germany are Sudanese (47.1%, a difference of 0.040%), Immigrants from Poland (47.1%, a difference of 0.050%), South American (47.1%, a difference of 0.070%), Kenyan (47.1%, a difference of 0.080%), and Immigrants from Kenya (47.2%, a difference of 0.21%).
| Demographics | Rating | Rank | Associate's Degree |
| Immigrants | North Macedonia | 76.0 /100 | #151 | Good 47.4% |
| Immigrants | Afghanistan | 74.3 /100 | #152 | Good 47.3% |
| Czechs | 72.2 /100 | #153 | Good 47.2% |
| Immigrants | Kenya | 72.1 /100 | #154 | Good 47.2% |
| Kenyans | 70.6 /100 | #155 | Good 47.1% |
| South Americans | 70.5 /100 | #156 | Good 47.1% |
| Sudanese | 70.3 /100 | #157 | Good 47.1% |
| Immigrants | Germany | 69.7 /100 | #158 | Good 47.1% |
| Immigrants | Poland | 69.2 /100 | #159 | Good 47.1% |
| Scottish | 65.4 /100 | #160 | Good 46.9% |
| Scandinavians | 65.2 /100 | #161 | Good 46.9% |
| Immigrants | Africa | 63.2 /100 | #162 | Good 46.8% |
| Somalis | 62.5 /100 | #163 | Good 46.8% |
| Colombians | 62.4 /100 | #164 | Good 46.8% |
| Immigrants | South America | 59.9 /100 | #165 | Average 46.7% |