Panamanian vs Welsh Associate's Degree
COMPARE
Panamanian
Welsh
Associate's Degree
Associate's Degree Comparison
Panamanians
Welsh
45.1%
ASSOCIATE'S DEGREE
18.4/ 100
METRIC RATING
207th/ 347
METRIC RANK
45.9%
ASSOCIATE'S DEGREE
37.9/ 100
METRIC RATING
186th/ 347
METRIC RANK
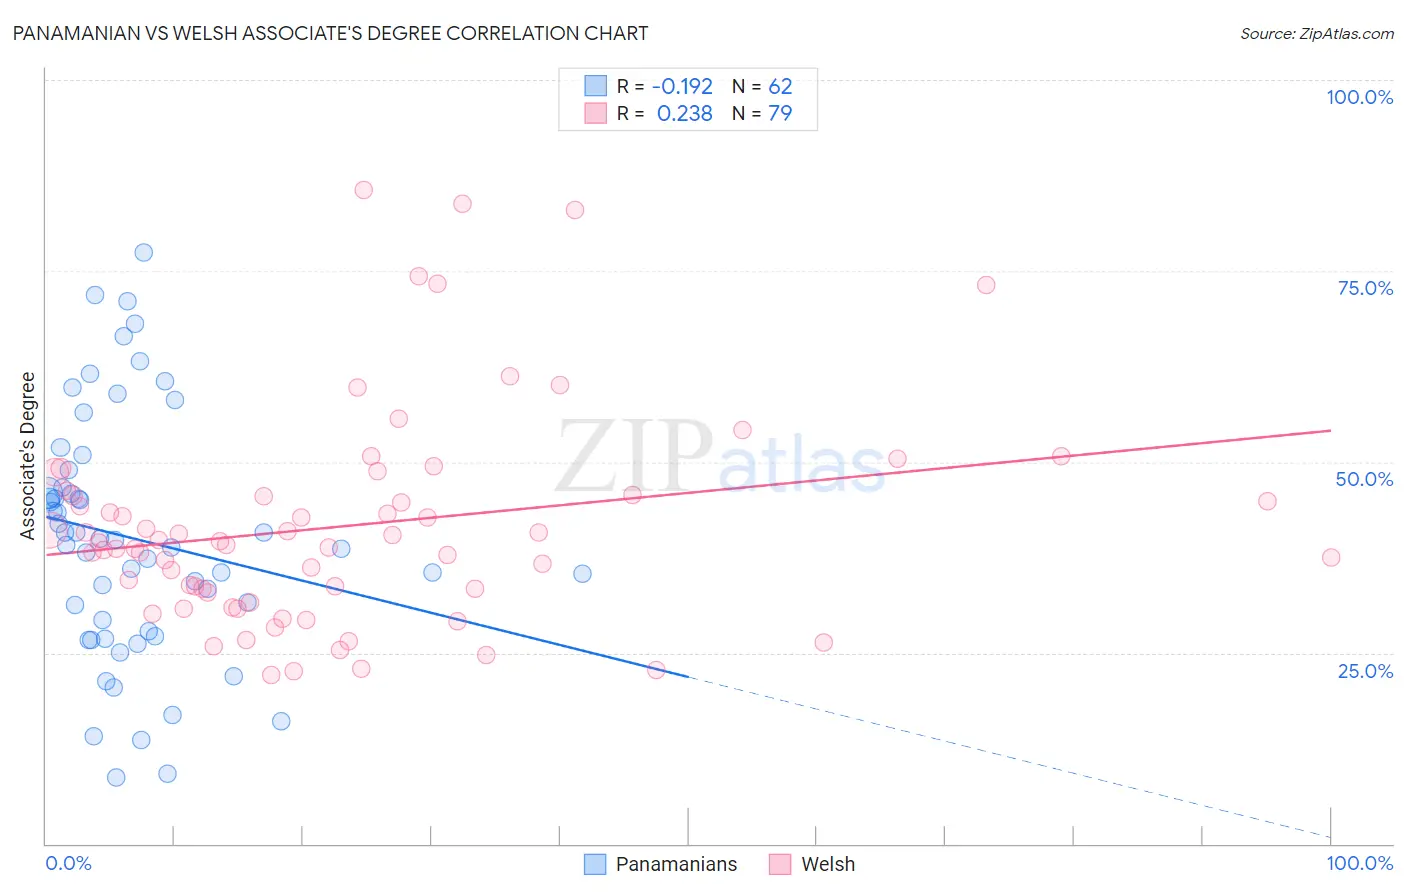
Panamanian vs Welsh Associate's Degree Correlation Chart
The statistical analysis conducted on geographies consisting of 281,234,684 people shows a poor negative correlation between the proportion of Panamanians and percentage of population with at least associate's degree education in the United States with a correlation coefficient (R) of -0.192 and weighted average of 45.1%. Similarly, the statistical analysis conducted on geographies consisting of 528,554,894 people shows a weak positive correlation between the proportion of Welsh and percentage of population with at least associate's degree education in the United States with a correlation coefficient (R) of 0.238 and weighted average of 45.9%, a difference of 1.9%.
Associate's Degree Correlation Summary
| Measurement | Panamanian | Welsh |
| Minimum | 8.6% | 22.1% |
| Maximum | 77.4% | 85.6% |
| Range | 68.8% | 63.5% |
| Mean | 39.9% | 41.7% |
| Median | 39.4% | 39.4% |
| Interquartile 25% (IQ1) | 27.9% | 32.9% |
| Interquartile 75% (IQ3) | 46.6% | 45.7% |
| Interquartile Range (IQR) | 18.7% | 12.8% |
| Standard Deviation (Sample) | 15.9% | 14.0% |
| Standard Deviation (Population) | 15.8% | 13.9% |
Similar Demographics by Associate's Degree
Demographics Similar to Panamanians by Associate's Degree
In terms of associate's degree, the demographic groups most similar to Panamanians are Immigrants from Thailand (45.1%, a difference of 0.070%), German Russian (45.1%, a difference of 0.070%), Nigerian (45.1%, a difference of 0.090%), Dutch (45.0%, a difference of 0.10%), and Immigrants from Costa Rica (45.0%, a difference of 0.22%).
| Demographics | Rating | Rank | Associate's Degree |
| Senegalese | 21.1 /100 | #200 | Fair 45.2% |
| Immigrants | Vietnam | 20.8 /100 | #201 | Fair 45.2% |
| Spaniards | 20.4 /100 | #202 | Fair 45.2% |
| Immigrants | South Eastern Asia | 20.2 /100 | #203 | Fair 45.2% |
| Nigerians | 19.1 /100 | #204 | Poor 45.1% |
| Immigrants | Thailand | 18.9 /100 | #205 | Poor 45.1% |
| German Russians | 18.9 /100 | #206 | Poor 45.1% |
| Panamanians | 18.4 /100 | #207 | Poor 45.1% |
| Dutch | 17.6 /100 | #208 | Poor 45.0% |
| Immigrants | Costa Rica | 16.7 /100 | #209 | Poor 45.0% |
| Immigrants | Philippines | 16.7 /100 | #210 | Poor 45.0% |
| Immigrants | Zaire | 16.6 /100 | #211 | Poor 45.0% |
| French Canadians | 15.0 /100 | #212 | Poor 44.9% |
| Immigrants | Ghana | 14.2 /100 | #213 | Poor 44.8% |
| Immigrants | Middle Africa | 12.7 /100 | #214 | Poor 44.7% |
Demographics Similar to Welsh by Associate's Degree
In terms of associate's degree, the demographic groups most similar to Welsh are Costa Rican (46.0%, a difference of 0.060%), Czechoslovakian (46.0%, a difference of 0.17%), Yugoslavian (46.0%, a difference of 0.19%), Swiss (46.0%, a difference of 0.20%), and Immigrants from Uruguay (45.8%, a difference of 0.20%).
| Demographics | Rating | Rank | Associate's Degree |
| Sri Lankans | 47.6 /100 | #179 | Average 46.3% |
| Bermudans | 46.4 /100 | #180 | Average 46.2% |
| Immigrants | Colombia | 41.3 /100 | #181 | Average 46.0% |
| Swiss | 40.4 /100 | #182 | Average 46.0% |
| Yugoslavians | 40.2 /100 | #183 | Average 46.0% |
| Czechoslovakians | 40.0 /100 | #184 | Average 46.0% |
| Costa Ricans | 38.6 /100 | #185 | Fair 46.0% |
| Welsh | 37.9 /100 | #186 | Fair 45.9% |
| Immigrants | Uruguay | 35.5 /100 | #187 | Fair 45.8% |
| Ghanaians | 35.5 /100 | #188 | Fair 45.8% |
| Immigrants | Oceania | 34.7 /100 | #189 | Fair 45.8% |
| Vietnamese | 34.0 /100 | #190 | Fair 45.8% |
| Koreans | 33.8 /100 | #191 | Fair 45.8% |
| Celtics | 33.3 /100 | #192 | Fair 45.8% |
| Immigrants | Cameroon | 31.0 /100 | #193 | Fair 45.7% |