Pakistani vs Arab GED/Equivalency
COMPARE
Pakistani
Arab
GED/Equivalency
GED/Equivalency Comparison
Pakistanis
Arabs
86.4%
GED/EQUIVALENCY
80.4/ 100
METRIC RATING
145th/ 347
METRIC RANK
86.6%
GED/EQUIVALENCY
86.7/ 100
METRIC RATING
137th/ 347
METRIC RANK
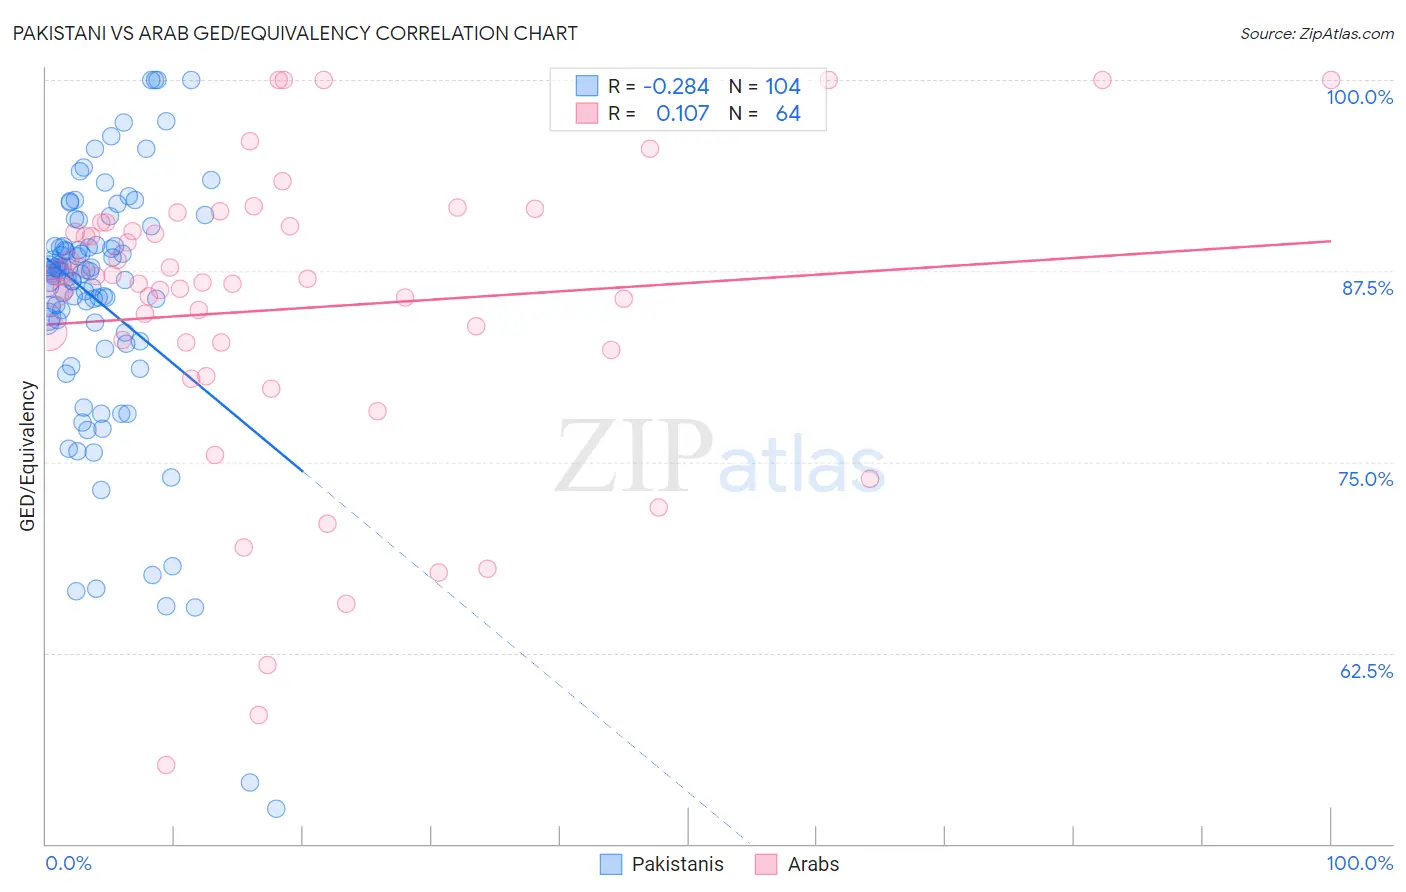
Pakistani vs Arab GED/Equivalency Correlation Chart
The statistical analysis conducted on geographies consisting of 335,356,802 people shows a weak negative correlation between the proportion of Pakistanis and percentage of population with at least ged/equivalency education in the United States with a correlation coefficient (R) of -0.284 and weighted average of 86.4%. Similarly, the statistical analysis conducted on geographies consisting of 486,870,847 people shows a poor positive correlation between the proportion of Arabs and percentage of population with at least ged/equivalency education in the United States with a correlation coefficient (R) of 0.107 and weighted average of 86.6%, a difference of 0.24%.
GED/Equivalency Correlation Summary
| Measurement | Pakistani | Arab |
| Minimum | 52.3% | 55.1% |
| Maximum | 100.0% | 100.0% |
| Range | 47.7% | 44.9% |
| Mean | 85.4% | 85.0% |
| Median | 87.3% | 86.7% |
| Interquartile 25% (IQ1) | 83.2% | 82.6% |
| Interquartile 75% (IQ3) | 89.1% | 90.6% |
| Interquartile Range (IQR) | 5.9% | 8.0% |
| Standard Deviation (Sample) | 8.6% | 9.9% |
| Standard Deviation (Population) | 8.6% | 9.9% |
Demographics Similar to Pakistanis and Arabs by GED/Equivalency
In terms of ged/equivalency, the demographic groups most similar to Pakistanis are Basque (86.4%, a difference of 0.030%), Immigrants from Northern Africa (86.3%, a difference of 0.030%), Immigrants from Poland (86.3%, a difference of 0.030%), Menominee (86.3%, a difference of 0.040%), and Immigrants from Western Asia (86.3%, a difference of 0.050%). Similarly, the demographic groups most similar to Arabs are Chilean (86.6%, a difference of 0.010%), Immigrants from Argentina (86.6%, a difference of 0.010%), Immigrants from Asia (86.6%, a difference of 0.030%), Albanian (86.6%, a difference of 0.040%), and Immigrants from Malaysia (86.5%, a difference of 0.070%).
| Demographics | Rating | Rank | GED/Equivalency |
| Immigrants | Spain | 88.5 /100 | #131 | Excellent 86.7% |
| Immigrants | Brazil | 88.4 /100 | #132 | Excellent 86.6% |
| Tsimshian | 88.3 /100 | #133 | Excellent 86.6% |
| Albanians | 87.7 /100 | #134 | Excellent 86.6% |
| Immigrants | Asia | 87.4 /100 | #135 | Excellent 86.6% |
| Chileans | 86.9 /100 | #136 | Excellent 86.6% |
| Arabs | 86.7 /100 | #137 | Excellent 86.6% |
| Immigrants | Argentina | 86.5 /100 | #138 | Excellent 86.6% |
| Immigrants | Malaysia | 85.0 /100 | #139 | Excellent 86.5% |
| Paraguayans | 84.1 /100 | #140 | Excellent 86.5% |
| Laotians | 83.2 /100 | #141 | Excellent 86.5% |
| Immigrants | Indonesia | 82.4 /100 | #142 | Excellent 86.4% |
| Immigrants | Pakistan | 82.4 /100 | #143 | Excellent 86.4% |
| Bolivians | 82.1 /100 | #144 | Excellent 86.4% |
| Pakistanis | 80.4 /100 | #145 | Excellent 86.4% |
| Basques | 79.5 /100 | #146 | Good 86.4% |
| Immigrants | Northern Africa | 79.3 /100 | #147 | Good 86.3% |
| Immigrants | Poland | 79.3 /100 | #148 | Good 86.3% |
| Menominee | 79.3 /100 | #149 | Good 86.3% |
| Immigrants | Western Asia | 78.8 /100 | #150 | Good 86.3% |
| Immigrants | Bosnia and Herzegovina | 77.9 /100 | #151 | Good 86.3% |