Pakistani vs Arab Doctorate Degree
COMPARE
Pakistani
Arab
Doctorate Degree
Doctorate Degree Comparison
Pakistanis
Arabs
2.0%
DOCTORATE DEGREE
95.8/ 100
METRIC RATING
119th/ 347
METRIC RANK
2.1%
DOCTORATE DEGREE
97.8/ 100
METRIC RATING
105th/ 347
METRIC RANK
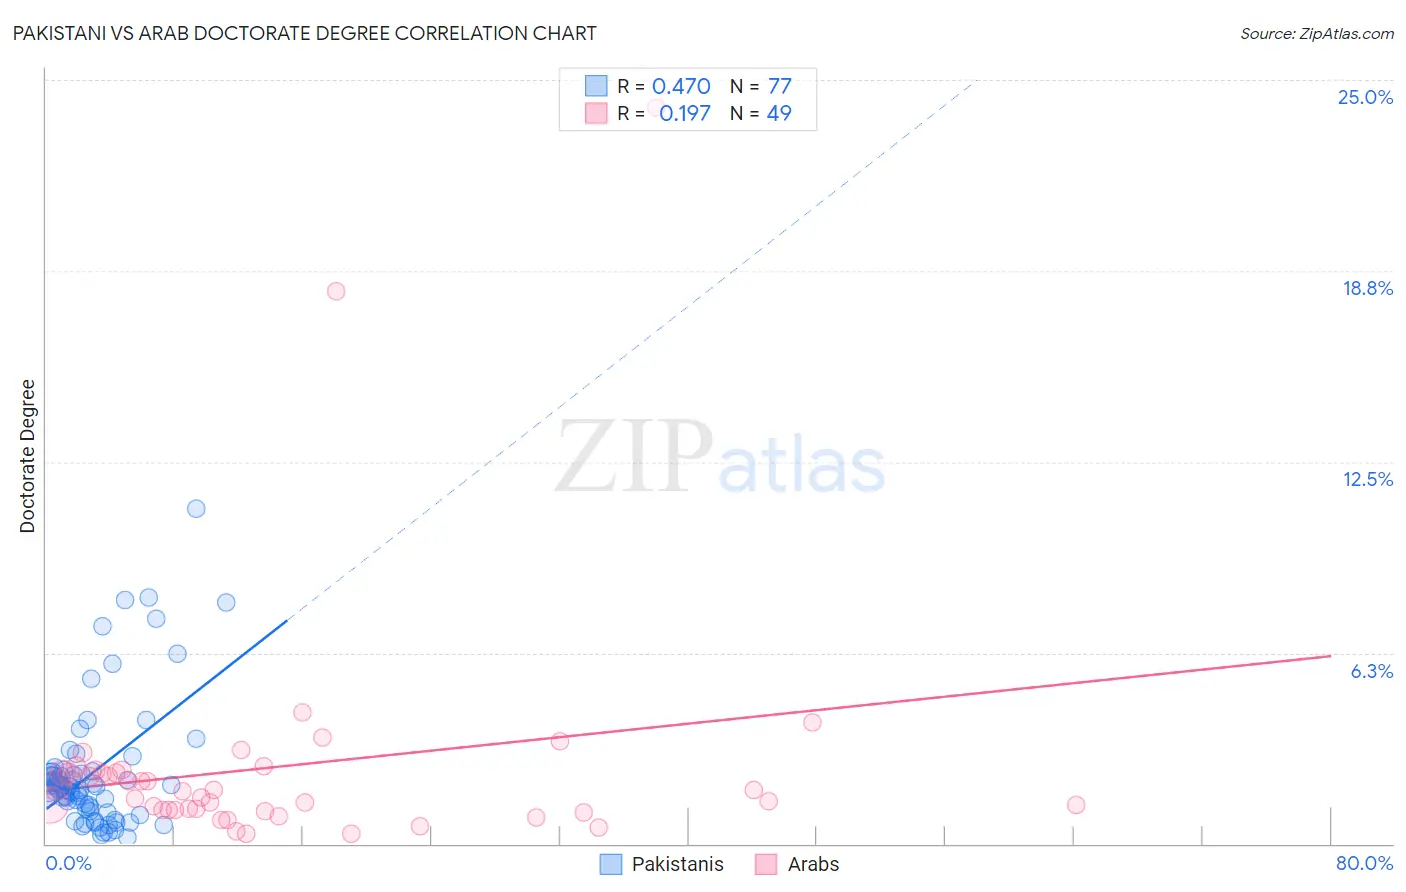
Pakistani vs Arab Doctorate Degree Correlation Chart
The statistical analysis conducted on geographies consisting of 333,015,067 people shows a moderate positive correlation between the proportion of Pakistanis and percentage of population with at least doctorate degree education in the United States with a correlation coefficient (R) of 0.470 and weighted average of 2.0%. Similarly, the statistical analysis conducted on geographies consisting of 479,921,881 people shows a poor positive correlation between the proportion of Arabs and percentage of population with at least doctorate degree education in the United States with a correlation coefficient (R) of 0.197 and weighted average of 2.1%, a difference of 2.2%.
Doctorate Degree Correlation Summary
| Measurement | Pakistani | Arab |
| Minimum | 0.22% | 0.33% |
| Maximum | 11.0% | 24.1% |
| Range | 10.8% | 23.8% |
| Mean | 2.4% | 2.5% |
| Median | 1.9% | 1.7% |
| Interquartile 25% (IQ1) | 1.1% | 1.1% |
| Interquartile 75% (IQ3) | 2.4% | 2.4% |
| Interquartile Range (IQR) | 1.3% | 1.3% |
| Standard Deviation (Sample) | 2.1% | 4.0% |
| Standard Deviation (Population) | 2.1% | 4.0% |
Demographics Similar to Pakistanis and Arabs by Doctorate Degree
In terms of doctorate degree, the demographic groups most similar to Pakistanis are Icelander (2.1%, a difference of 0.13%), Lebanese (2.1%, a difference of 0.17%), Immigrants from Morocco (2.0%, a difference of 0.28%), Maltese (2.1%, a difference of 0.34%), and Immigrants from Jordan (2.0%, a difference of 0.76%). Similarly, the demographic groups most similar to Arabs are Sudanese (2.1%, a difference of 0.10%), Austrian (2.1%, a difference of 0.35%), Romanian (2.1%, a difference of 0.47%), Immigrants from Chile (2.1%, a difference of 0.48%), and European (2.1%, a difference of 0.49%).
| Demographics | Rating | Rank | Doctorate Degree |
| Immigrants | Chile | 98.1 /100 | #102 | Exceptional 2.1% |
| Romanians | 98.1 /100 | #103 | Exceptional 2.1% |
| Austrians | 98.0 /100 | #104 | Exceptional 2.1% |
| Arabs | 97.8 /100 | #105 | Exceptional 2.1% |
| Sudanese | 97.7 /100 | #106 | Exceptional 2.1% |
| Europeans | 97.5 /100 | #107 | Exceptional 2.1% |
| Immigrants | Germany | 97.3 /100 | #108 | Exceptional 2.1% |
| Ukrainians | 97.2 /100 | #109 | Exceptional 2.1% |
| Brazilians | 97.2 /100 | #110 | Exceptional 2.1% |
| Immigrants | Pakistan | 97.1 /100 | #111 | Exceptional 2.1% |
| Syrians | 97.1 /100 | #112 | Exceptional 2.1% |
| Immigrants | Italy | 96.9 /100 | #113 | Exceptional 2.1% |
| Immigrants | Croatia | 96.8 /100 | #114 | Exceptional 2.1% |
| Taiwanese | 96.7 /100 | #115 | Exceptional 2.1% |
| Maltese | 96.2 /100 | #116 | Exceptional 2.1% |
| Lebanese | 96.0 /100 | #117 | Exceptional 2.1% |
| Icelanders | 96.0 /100 | #118 | Exceptional 2.1% |
| Pakistanis | 95.8 /100 | #119 | Exceptional 2.0% |
| Immigrants | Morocco | 95.5 /100 | #120 | Exceptional 2.0% |
| Immigrants | Jordan | 94.8 /100 | #121 | Exceptional 2.0% |
| Immigrants | Southern Europe | 94.7 /100 | #122 | Exceptional 2.0% |