Immigrants from Kazakhstan vs Arab GED/Equivalency
COMPARE
Immigrants from Kazakhstan
Arab
GED/Equivalency
GED/Equivalency Comparison
Immigrants from Kazakhstan
Arabs
87.0%
GED/EQUIVALENCY
94.7/ 100
METRIC RATING
114th/ 347
METRIC RANK
86.6%
GED/EQUIVALENCY
86.7/ 100
METRIC RATING
137th/ 347
METRIC RANK
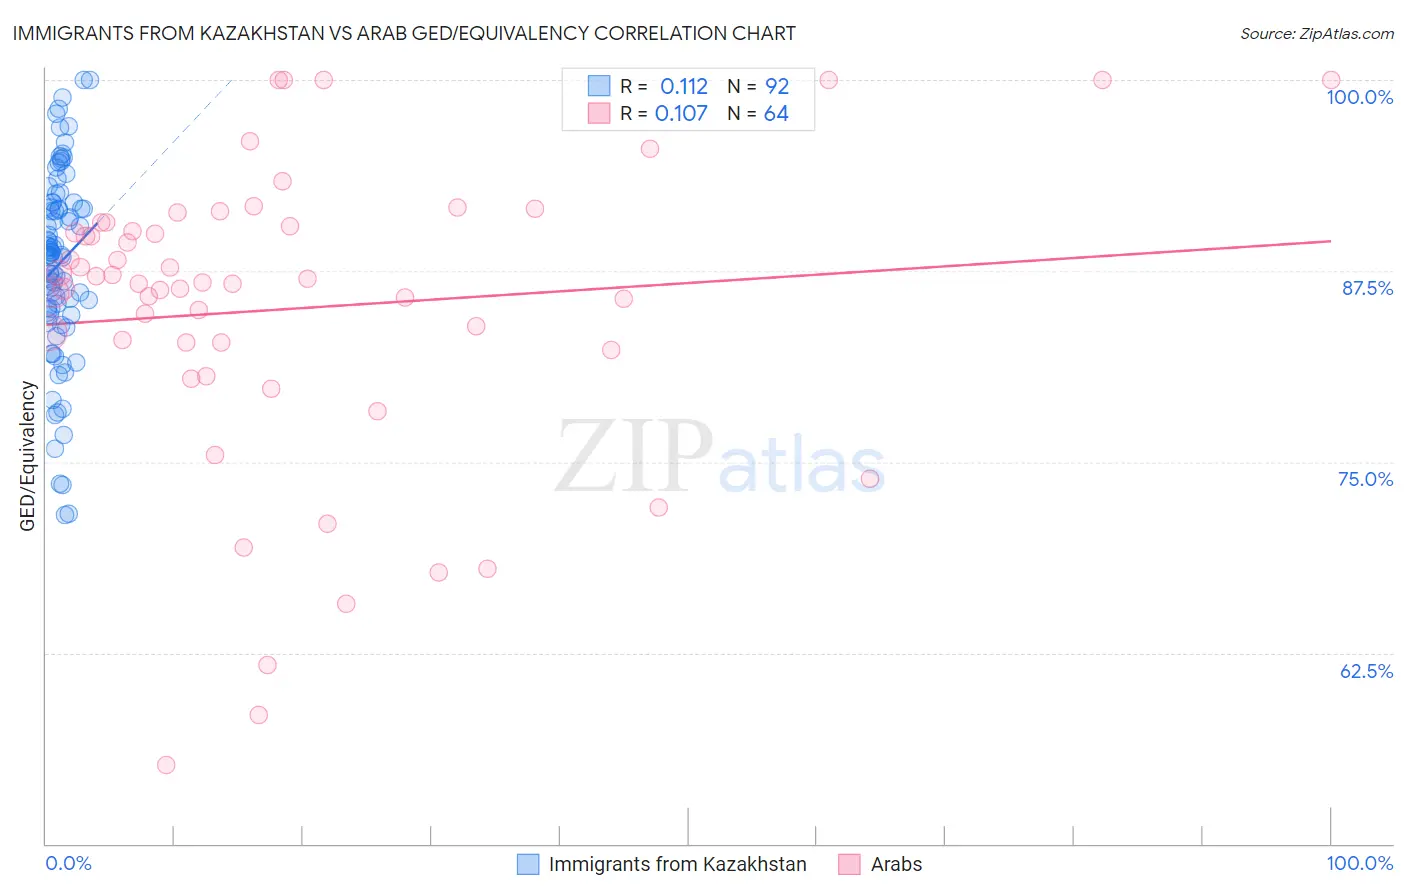
Immigrants from Kazakhstan vs Arab GED/Equivalency Correlation Chart
The statistical analysis conducted on geographies consisting of 124,444,172 people shows a poor positive correlation between the proportion of Immigrants from Kazakhstan and percentage of population with at least ged/equivalency education in the United States with a correlation coefficient (R) of 0.112 and weighted average of 87.0%. Similarly, the statistical analysis conducted on geographies consisting of 486,870,847 people shows a poor positive correlation between the proportion of Arabs and percentage of population with at least ged/equivalency education in the United States with a correlation coefficient (R) of 0.107 and weighted average of 86.6%, a difference of 0.51%.
GED/Equivalency Correlation Summary
| Measurement | Immigrants from Kazakhstan | Arab |
| Minimum | 71.5% | 55.1% |
| Maximum | 100.0% | 100.0% |
| Range | 28.5% | 44.9% |
| Mean | 87.9% | 85.0% |
| Median | 88.5% | 86.7% |
| Interquartile 25% (IQ1) | 84.8% | 82.6% |
| Interquartile 75% (IQ3) | 91.8% | 90.6% |
| Interquartile Range (IQR) | 7.0% | 8.0% |
| Standard Deviation (Sample) | 6.2% | 9.9% |
| Standard Deviation (Population) | 6.2% | 9.9% |
Similar Demographics by GED/Equivalency
Demographics Similar to Immigrants from Kazakhstan by GED/Equivalency
In terms of ged/equivalency, the demographic groups most similar to Immigrants from Kazakhstan are Tlingit-Haida (87.0%, a difference of 0.010%), Assyrian/Chaldean/Syriac (87.0%, a difference of 0.010%), Mongolian (87.0%, a difference of 0.010%), Swiss (87.0%, a difference of 0.020%), and Egyptian (87.1%, a difference of 0.060%).
| Demographics | Rating | Rank | GED/Equivalency |
| Icelanders | 95.7 /100 | #107 | Exceptional 87.1% |
| Canadians | 95.6 /100 | #108 | Exceptional 87.1% |
| Immigrants | Eastern Europe | 95.5 /100 | #109 | Exceptional 87.1% |
| Egyptians | 95.3 /100 | #110 | Exceptional 87.1% |
| French | 95.2 /100 | #111 | Exceptional 87.1% |
| Tlingit-Haida | 94.8 /100 | #112 | Exceptional 87.0% |
| Assyrians/Chaldeans/Syriacs | 94.8 /100 | #113 | Exceptional 87.0% |
| Immigrants | Kazakhstan | 94.7 /100 | #114 | Exceptional 87.0% |
| Mongolians | 94.6 /100 | #115 | Exceptional 87.0% |
| Swiss | 94.5 /100 | #116 | Exceptional 87.0% |
| Immigrants | Hong Kong | 93.8 /100 | #117 | Exceptional 86.9% |
| French Canadians | 93.2 /100 | #118 | Exceptional 86.9% |
| Immigrants | China | 93.2 /100 | #119 | Exceptional 86.9% |
| Scotch-Irish | 91.6 /100 | #120 | Exceptional 86.8% |
| Immigrants | Lebanon | 90.9 /100 | #121 | Exceptional 86.8% |
Demographics Similar to Arabs by GED/Equivalency
In terms of ged/equivalency, the demographic groups most similar to Arabs are Chilean (86.6%, a difference of 0.010%), Immigrants from Argentina (86.6%, a difference of 0.010%), Immigrants from Asia (86.6%, a difference of 0.030%), Albanian (86.6%, a difference of 0.040%), and Immigrants from Malaysia (86.5%, a difference of 0.070%).
| Demographics | Rating | Rank | GED/Equivalency |
| Immigrants | Germany | 88.8 /100 | #130 | Excellent 86.7% |
| Immigrants | Spain | 88.5 /100 | #131 | Excellent 86.7% |
| Immigrants | Brazil | 88.4 /100 | #132 | Excellent 86.6% |
| Tsimshian | 88.3 /100 | #133 | Excellent 86.6% |
| Albanians | 87.7 /100 | #134 | Excellent 86.6% |
| Immigrants | Asia | 87.4 /100 | #135 | Excellent 86.6% |
| Chileans | 86.9 /100 | #136 | Excellent 86.6% |
| Arabs | 86.7 /100 | #137 | Excellent 86.6% |
| Immigrants | Argentina | 86.5 /100 | #138 | Excellent 86.6% |
| Immigrants | Malaysia | 85.0 /100 | #139 | Excellent 86.5% |
| Paraguayans | 84.1 /100 | #140 | Excellent 86.5% |
| Laotians | 83.2 /100 | #141 | Excellent 86.5% |
| Immigrants | Indonesia | 82.4 /100 | #142 | Excellent 86.4% |
| Immigrants | Pakistan | 82.4 /100 | #143 | Excellent 86.4% |
| Bolivians | 82.1 /100 | #144 | Excellent 86.4% |