Immigrants from Bolivia vs Arab GED/Equivalency
COMPARE
Immigrants from Bolivia
Arab
GED/Equivalency
GED/Equivalency Comparison
Immigrants from Bolivia
Arabs
85.8%
GED/EQUIVALENCY
49.8/ 100
METRIC RATING
175th/ 347
METRIC RANK
86.6%
GED/EQUIVALENCY
86.7/ 100
METRIC RATING
137th/ 347
METRIC RANK
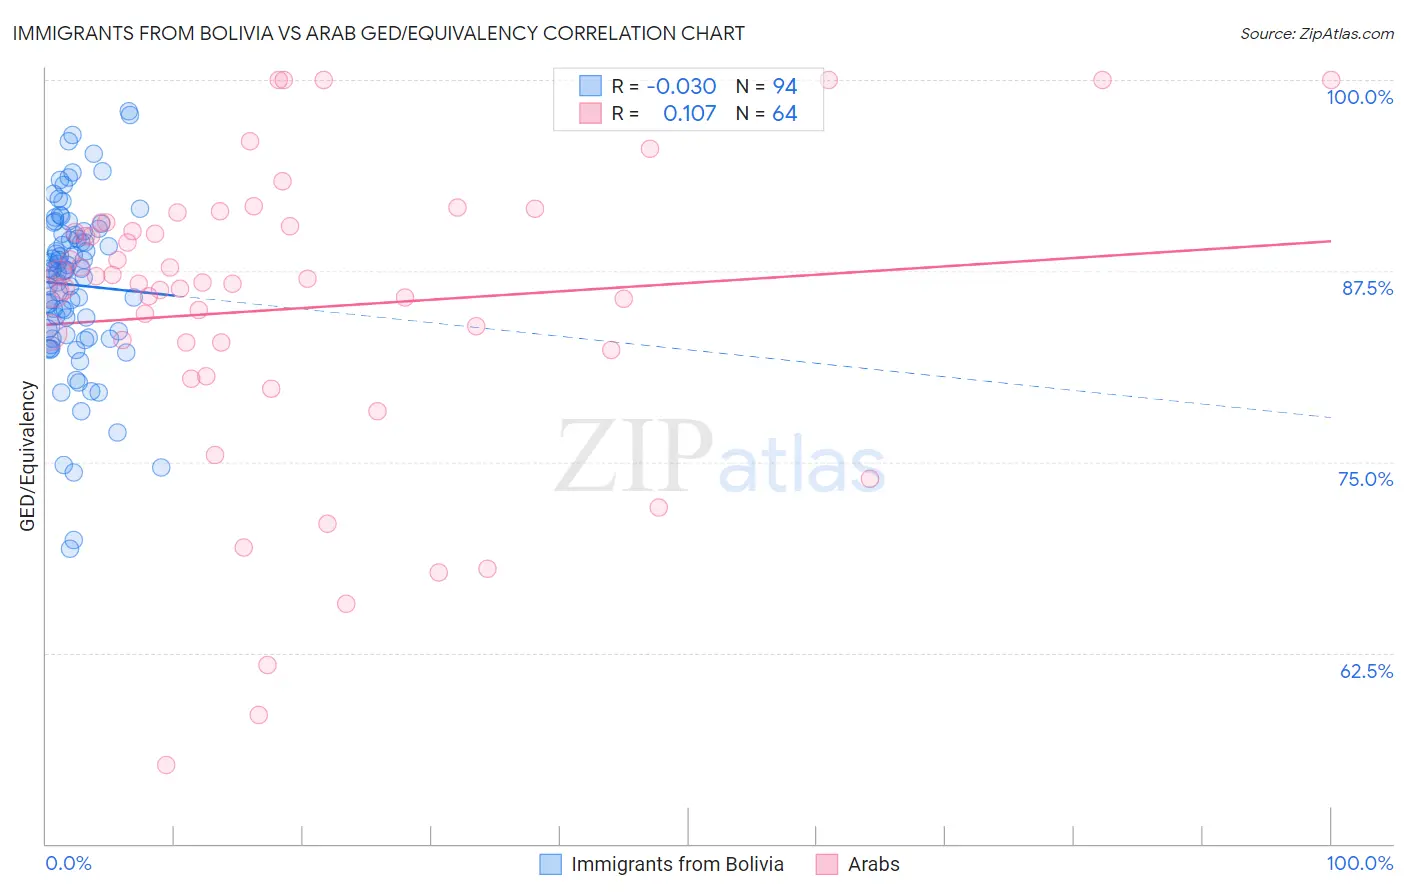
Immigrants from Bolivia vs Arab GED/Equivalency Correlation Chart
The statistical analysis conducted on geographies consisting of 158,730,894 people shows no correlation between the proportion of Immigrants from Bolivia and percentage of population with at least ged/equivalency education in the United States with a correlation coefficient (R) of -0.030 and weighted average of 85.8%. Similarly, the statistical analysis conducted on geographies consisting of 486,870,847 people shows a poor positive correlation between the proportion of Arabs and percentage of population with at least ged/equivalency education in the United States with a correlation coefficient (R) of 0.107 and weighted average of 86.6%, a difference of 0.97%.
GED/Equivalency Correlation Summary
| Measurement | Immigrants from Bolivia | Arab |
| Minimum | 69.3% | 55.1% |
| Maximum | 98.0% | 100.0% |
| Range | 28.7% | 44.9% |
| Mean | 86.6% | 85.0% |
| Median | 87.5% | 86.7% |
| Interquartile 25% (IQ1) | 83.3% | 82.6% |
| Interquartile 75% (IQ3) | 90.0% | 90.6% |
| Interquartile Range (IQR) | 6.7% | 8.0% |
| Standard Deviation (Sample) | 5.5% | 9.9% |
| Standard Deviation (Population) | 5.4% | 9.9% |
Similar Demographics by GED/Equivalency
Demographics Similar to Immigrants from Bolivia by GED/Equivalency
In terms of ged/equivalency, the demographic groups most similar to Immigrants from Bolivia are Ottawa (85.8%, a difference of 0.0%), Immigrants from Venezuela (85.8%, a difference of 0.020%), Immigrants from Eastern Africa (85.7%, a difference of 0.040%), Immigrants from Uganda (85.7%, a difference of 0.10%), and Bermudan (85.8%, a difference of 0.11%).
| Demographics | Rating | Rank | GED/Equivalency |
| Sierra Leoneans | 61.8 /100 | #168 | Good 86.0% |
| Immigrants | Ethiopia | 61.2 /100 | #169 | Good 86.0% |
| Afghans | 59.7 /100 | #170 | Average 85.9% |
| Immigrants | Chile | 57.3 /100 | #171 | Average 85.9% |
| Bermudans | 55.1 /100 | #172 | Average 85.8% |
| Immigrants | Venezuela | 50.7 /100 | #173 | Average 85.8% |
| Ottawa | 50.0 /100 | #174 | Average 85.8% |
| Immigrants | Bolivia | 49.8 /100 | #175 | Average 85.8% |
| Immigrants | Eastern Africa | 47.7 /100 | #176 | Average 85.7% |
| Immigrants | Uganda | 45.2 /100 | #177 | Average 85.7% |
| Koreans | 41.2 /100 | #178 | Average 85.6% |
| Aleuts | 40.5 /100 | #179 | Average 85.6% |
| Immigrants | Southern Europe | 38.4 /100 | #180 | Fair 85.5% |
| Moroccans | 37.7 /100 | #181 | Fair 85.5% |
| Sudanese | 35.2 /100 | #182 | Fair 85.5% |
Demographics Similar to Arabs by GED/Equivalency
In terms of ged/equivalency, the demographic groups most similar to Arabs are Chilean (86.6%, a difference of 0.010%), Immigrants from Argentina (86.6%, a difference of 0.010%), Immigrants from Asia (86.6%, a difference of 0.030%), Albanian (86.6%, a difference of 0.040%), and Immigrants from Malaysia (86.5%, a difference of 0.070%).
| Demographics | Rating | Rank | GED/Equivalency |
| Immigrants | Germany | 88.8 /100 | #130 | Excellent 86.7% |
| Immigrants | Spain | 88.5 /100 | #131 | Excellent 86.7% |
| Immigrants | Brazil | 88.4 /100 | #132 | Excellent 86.6% |
| Tsimshian | 88.3 /100 | #133 | Excellent 86.6% |
| Albanians | 87.7 /100 | #134 | Excellent 86.6% |
| Immigrants | Asia | 87.4 /100 | #135 | Excellent 86.6% |
| Chileans | 86.9 /100 | #136 | Excellent 86.6% |
| Arabs | 86.7 /100 | #137 | Excellent 86.6% |
| Immigrants | Argentina | 86.5 /100 | #138 | Excellent 86.6% |
| Immigrants | Malaysia | 85.0 /100 | #139 | Excellent 86.5% |
| Paraguayans | 84.1 /100 | #140 | Excellent 86.5% |
| Laotians | 83.2 /100 | #141 | Excellent 86.5% |
| Immigrants | Indonesia | 82.4 /100 | #142 | Excellent 86.4% |
| Immigrants | Pakistan | 82.4 /100 | #143 | Excellent 86.4% |
| Bolivians | 82.1 /100 | #144 | Excellent 86.4% |