Pakistani vs Soviet Union GED/Equivalency
COMPARE
Pakistani
Soviet Union
GED/Equivalency
GED/Equivalency Comparison
Pakistanis
Soviet Union
86.4%
GED/EQUIVALENCY
80.4/ 100
METRIC RATING
145th/ 347
METRIC RANK
88.0%
GED/EQUIVALENCY
99.4/ 100
METRIC RATING
54th/ 347
METRIC RANK
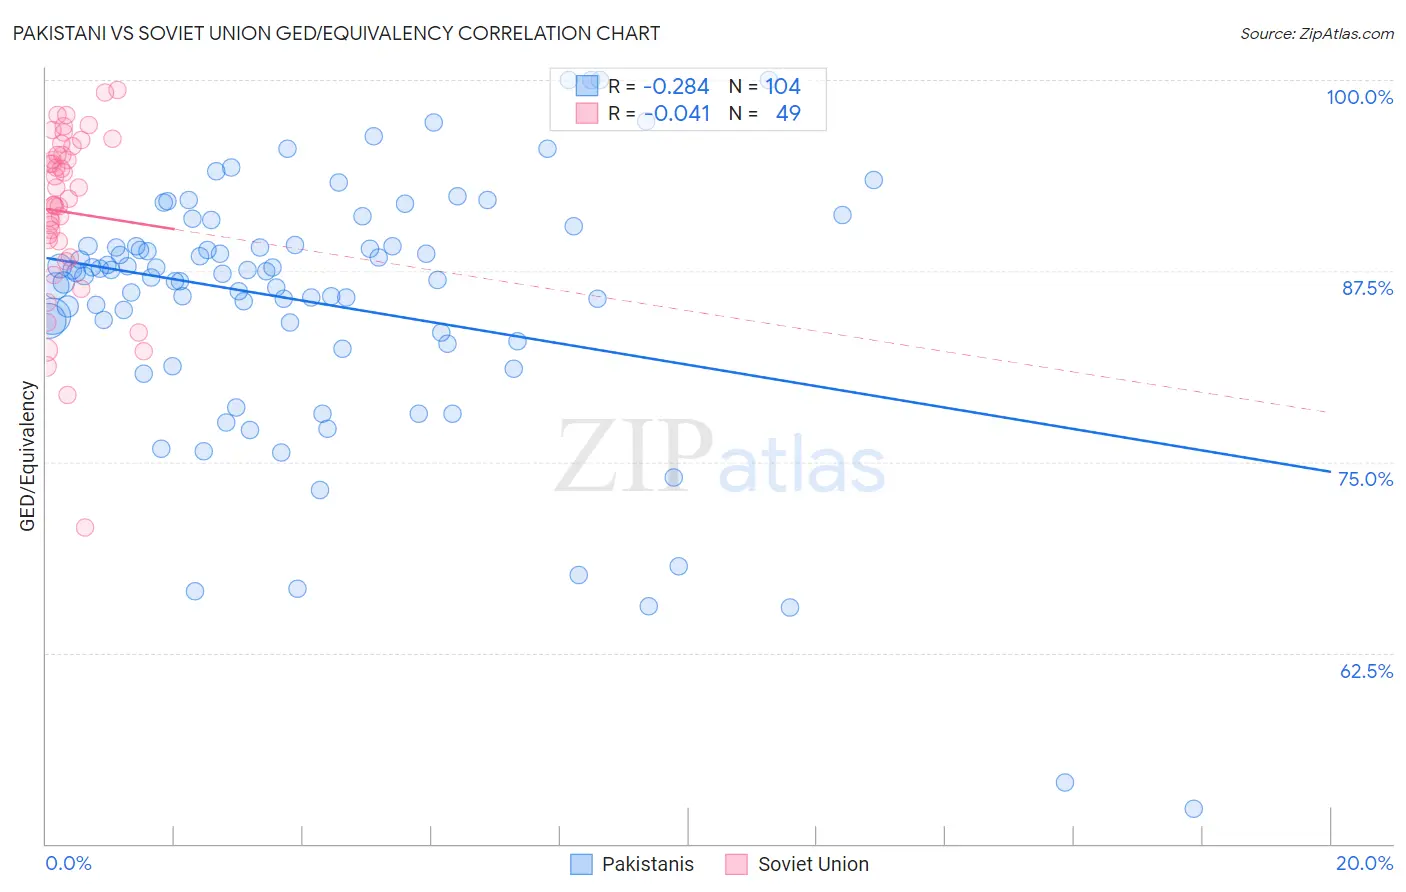
Pakistani vs Soviet Union GED/Equivalency Correlation Chart
The statistical analysis conducted on geographies consisting of 335,356,802 people shows a weak negative correlation between the proportion of Pakistanis and percentage of population with at least ged/equivalency education in the United States with a correlation coefficient (R) of -0.284 and weighted average of 86.4%. Similarly, the statistical analysis conducted on geographies consisting of 43,454,395 people shows no correlation between the proportion of Soviet Union and percentage of population with at least ged/equivalency education in the United States with a correlation coefficient (R) of -0.041 and weighted average of 88.0%, a difference of 1.9%.
GED/Equivalency Correlation Summary
| Measurement | Pakistani | Soviet Union |
| Minimum | 52.3% | 70.7% |
| Maximum | 100.0% | 99.4% |
| Range | 47.7% | 28.7% |
| Mean | 85.4% | 91.4% |
| Median | 87.3% | 92.2% |
| Interquartile 25% (IQ1) | 83.2% | 88.9% |
| Interquartile 75% (IQ3) | 89.1% | 95.4% |
| Interquartile Range (IQR) | 5.9% | 6.5% |
| Standard Deviation (Sample) | 8.6% | 5.7% |
| Standard Deviation (Population) | 8.6% | 5.7% |
Similar Demographics by GED/Equivalency
Demographics Similar to Pakistanis by GED/Equivalency
In terms of ged/equivalency, the demographic groups most similar to Pakistanis are Basque (86.4%, a difference of 0.030%), Immigrants from Northern Africa (86.3%, a difference of 0.030%), Immigrants from Poland (86.3%, a difference of 0.030%), Menominee (86.3%, a difference of 0.040%), and Immigrants from Western Asia (86.3%, a difference of 0.050%).
| Demographics | Rating | Rank | GED/Equivalency |
| Immigrants | Argentina | 86.5 /100 | #138 | Excellent 86.6% |
| Immigrants | Malaysia | 85.0 /100 | #139 | Excellent 86.5% |
| Paraguayans | 84.1 /100 | #140 | Excellent 86.5% |
| Laotians | 83.2 /100 | #141 | Excellent 86.5% |
| Immigrants | Indonesia | 82.4 /100 | #142 | Excellent 86.4% |
| Immigrants | Pakistan | 82.4 /100 | #143 | Excellent 86.4% |
| Bolivians | 82.1 /100 | #144 | Excellent 86.4% |
| Pakistanis | 80.4 /100 | #145 | Excellent 86.4% |
| Basques | 79.5 /100 | #146 | Good 86.4% |
| Immigrants | Northern Africa | 79.3 /100 | #147 | Good 86.3% |
| Immigrants | Poland | 79.3 /100 | #148 | Good 86.3% |
| Menominee | 79.3 /100 | #149 | Good 86.3% |
| Immigrants | Western Asia | 78.8 /100 | #150 | Good 86.3% |
| Immigrants | Bosnia and Herzegovina | 77.9 /100 | #151 | Good 86.3% |
| Brazilians | 77.2 /100 | #152 | Good 86.3% |
Demographics Similar to Soviet Union by GED/Equivalency
In terms of ged/equivalency, the demographic groups most similar to Soviet Union are New Zealander (88.0%, a difference of 0.0%), Immigrants from Netherlands (88.0%, a difference of 0.010%), Zimbabwean (88.0%, a difference of 0.010%), Immigrants from South Africa (88.0%, a difference of 0.010%), and Immigrants from Denmark (88.0%, a difference of 0.020%).
| Demographics | Rating | Rank | GED/Equivalency |
| Immigrants | Latvia | 99.5 /100 | #47 | Exceptional 88.1% |
| Greeks | 99.5 /100 | #48 | Exceptional 88.1% |
| Australians | 99.5 /100 | #49 | Exceptional 88.1% |
| Immigrants | Korea | 99.5 /100 | #50 | Exceptional 88.1% |
| Immigrants | Netherlands | 99.4 /100 | #51 | Exceptional 88.0% |
| Zimbabweans | 99.4 /100 | #52 | Exceptional 88.0% |
| Immigrants | South Africa | 99.4 /100 | #53 | Exceptional 88.0% |
| Soviet Union | 99.4 /100 | #54 | Exceptional 88.0% |
| New Zealanders | 99.4 /100 | #55 | Exceptional 88.0% |
| Immigrants | Denmark | 99.4 /100 | #56 | Exceptional 88.0% |
| Immigrants | Czechoslovakia | 99.3 /100 | #57 | Exceptional 87.9% |
| Northern Europeans | 99.3 /100 | #58 | Exceptional 87.9% |
| Serbians | 99.3 /100 | #59 | Exceptional 87.9% |
| Scandinavians | 99.3 /100 | #60 | Exceptional 87.9% |
| Europeans | 99.3 /100 | #61 | Exceptional 87.9% |