Ottawa vs U.S. Virgin Islander Master's Degree
COMPARE
Ottawa
U.S. Virgin Islander
Master's Degree
Master's Degree Comparison
Ottawa
U.S. Virgin Islanders
11.9%
MASTER'S DEGREE
0.2/ 100
METRIC RATING
284th/ 347
METRIC RANK
13.1%
MASTER'S DEGREE
2.1/ 100
METRIC RATING
241st/ 347
METRIC RANK
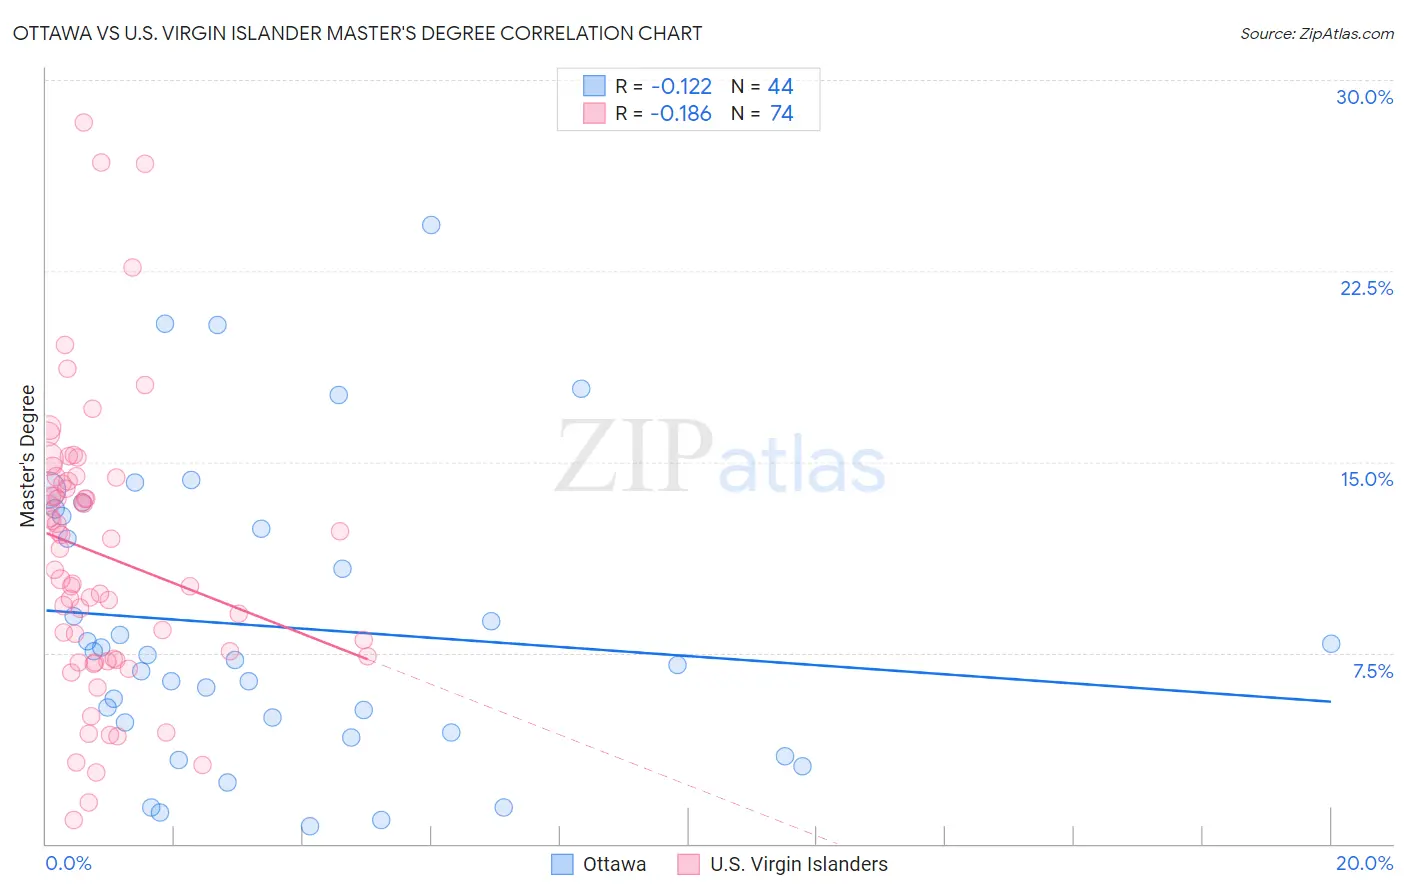
Ottawa vs U.S. Virgin Islander Master's Degree Correlation Chart
The statistical analysis conducted on geographies consisting of 49,953,326 people shows a poor negative correlation between the proportion of Ottawa and percentage of population with at least master's degree education in the United States with a correlation coefficient (R) of -0.122 and weighted average of 11.9%. Similarly, the statistical analysis conducted on geographies consisting of 87,520,164 people shows a poor negative correlation between the proportion of U.S. Virgin Islanders and percentage of population with at least master's degree education in the United States with a correlation coefficient (R) of -0.186 and weighted average of 13.1%, a difference of 10.3%.
Master's Degree Correlation Summary
| Measurement | Ottawa | U.S. Virgin Islander |
| Minimum | 0.69% | 0.93% |
| Maximum | 24.3% | 28.3% |
| Range | 23.6% | 27.4% |
| Mean | 8.5% | 11.4% |
| Median | 7.3% | 11.2% |
| Interquartile 25% (IQ1) | 4.6% | 7.2% |
| Interquartile 75% (IQ3) | 12.6% | 14.2% |
| Interquartile Range (IQR) | 8.0% | 7.0% |
| Standard Deviation (Sample) | 5.7% | 5.5% |
| Standard Deviation (Population) | 5.6% | 5.5% |
Similar Demographics by Master's Degree
Demographics Similar to Ottawa by Master's Degree
In terms of master's degree, the demographic groups most similar to Ottawa are Immigrants from Nicaragua (11.8%, a difference of 0.18%), Aleut (11.8%, a difference of 0.54%), Honduran (11.9%, a difference of 0.72%), Immigrants from Haiti (11.8%, a difference of 0.74%), and Immigrants from Honduras (11.8%, a difference of 0.90%).
| Demographics | Rating | Rank | Master's Degree |
| Immigrants | Caribbean | 0.3 /100 | #277 | Tragic 12.1% |
| Potawatomi | 0.3 /100 | #278 | Tragic 12.1% |
| Immigrants | Belize | 0.2 /100 | #279 | Tragic 12.1% |
| Immigrants | Dominican Republic | 0.2 /100 | #280 | Tragic 12.1% |
| Malaysians | 0.2 /100 | #281 | Tragic 12.0% |
| Immigrants | El Salvador | 0.2 /100 | #282 | Tragic 12.0% |
| Hondurans | 0.2 /100 | #283 | Tragic 11.9% |
| Ottawa | 0.2 /100 | #284 | Tragic 11.9% |
| Immigrants | Nicaragua | 0.2 /100 | #285 | Tragic 11.8% |
| Aleuts | 0.1 /100 | #286 | Tragic 11.8% |
| Immigrants | Haiti | 0.1 /100 | #287 | Tragic 11.8% |
| Immigrants | Honduras | 0.1 /100 | #288 | Tragic 11.8% |
| Guatemalans | 0.1 /100 | #289 | Tragic 11.7% |
| Ute | 0.1 /100 | #290 | Tragic 11.7% |
| Colville | 0.1 /100 | #291 | Tragic 11.6% |
Demographics Similar to U.S. Virgin Islanders by Master's Degree
In terms of master's degree, the demographic groups most similar to U.S. Virgin Islanders are Guamanian/Chamorro (13.1%, a difference of 0.14%), Spanish American (13.0%, a difference of 0.28%), Immigrants from Jamaica (13.0%, a difference of 0.32%), Delaware (13.0%, a difference of 0.70%), and Immigrants from Bahamas (12.9%, a difference of 1.4%).
| Demographics | Rating | Rank | Master's Degree |
| Immigrants | Burma/Myanmar | 5.0 /100 | #234 | Tragic 13.5% |
| German Russians | 4.5 /100 | #235 | Tragic 13.5% |
| Immigrants | Guyana | 4.4 /100 | #236 | Tragic 13.4% |
| Jamaicans | 4.1 /100 | #237 | Tragic 13.4% |
| Hmong | 4.0 /100 | #238 | Tragic 13.4% |
| Immigrants | Nonimmigrants | 3.4 /100 | #239 | Tragic 13.3% |
| Guamanians/Chamorros | 2.2 /100 | #240 | Tragic 13.1% |
| U.S. Virgin Islanders | 2.1 /100 | #241 | Tragic 13.1% |
| Spanish Americans | 1.9 /100 | #242 | Tragic 13.0% |
| Immigrants | Jamaica | 1.9 /100 | #243 | Tragic 13.0% |
| Delaware | 1.7 /100 | #244 | Tragic 13.0% |
| Immigrants | Bahamas | 1.4 /100 | #245 | Tragic 12.9% |
| Immigrants | Cambodia | 1.4 /100 | #246 | Tragic 12.9% |
| Iroquois | 1.4 /100 | #247 | Tragic 12.9% |
| Africans | 1.4 /100 | #248 | Tragic 12.9% |