Norwegian vs Immigrants from Lithuania No Schooling Completed
COMPARE
Norwegian
Immigrants from Lithuania
No Schooling Completed
No Schooling Completed Comparison
Norwegians
Immigrants from Lithuania
1.3%
NO SCHOOLING COMPLETED
100.0/ 100
METRIC RATING
3rd/ 347
METRIC RANK
1.7%
NO SCHOOLING COMPLETED
99.7/ 100
METRIC RATING
68th/ 347
METRIC RANK
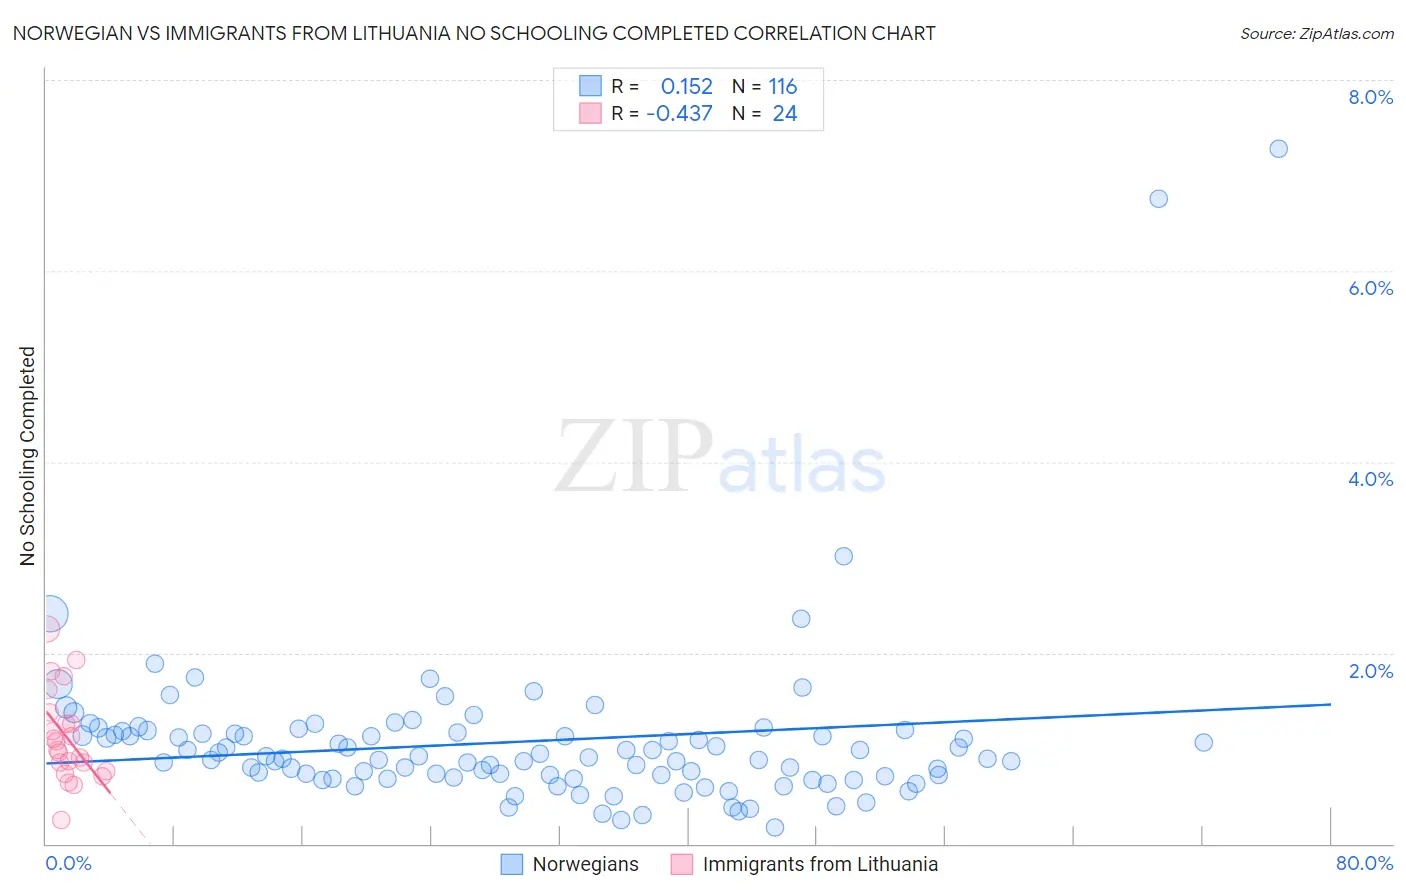
Norwegian vs Immigrants from Lithuania No Schooling Completed Correlation Chart
The statistical analysis conducted on geographies consisting of 518,592,582 people shows a poor positive correlation between the proportion of Norwegians and percentage of population with no schooling in the United States with a correlation coefficient (R) of 0.152 and weighted average of 1.3%. Similarly, the statistical analysis conducted on geographies consisting of 117,352,056 people shows a moderate negative correlation between the proportion of Immigrants from Lithuania and percentage of population with no schooling in the United States with a correlation coefficient (R) of -0.437 and weighted average of 1.7%, a difference of 25.3%.
No Schooling Completed Correlation Summary
| Measurement | Norwegian | Immigrants from Lithuania |
| Minimum | 0.17% | 0.25% |
| Maximum | 7.3% | 2.2% |
| Range | 7.1% | 2.0% |
| Mean | 1.1% | 1.1% |
| Median | 0.89% | 1.0% |
| Interquartile 25% (IQ1) | 0.70% | 0.80% |
| Interquartile 75% (IQ3) | 1.2% | 1.3% |
| Interquartile Range (IQR) | 0.46% | 0.52% |
| Standard Deviation (Sample) | 0.90% | 0.47% |
| Standard Deviation (Population) | 0.90% | 0.46% |
Similar Demographics by No Schooling Completed
Demographics Similar to Norwegians by No Schooling Completed
In terms of no schooling completed, the demographic groups most similar to Norwegians are Slovak (1.3%, a difference of 0.43%), German (1.4%, a difference of 0.56%), Slovene (1.4%, a difference of 0.98%), Carpatho Rusyn (1.4%, a difference of 1.8%), and English (1.4%, a difference of 2.8%).
| Demographics | Rating | Rank | No Schooling Completed |
| Yup'ik | 100.0 /100 | #1 | Exceptional 1.2% |
| Slovaks | 100.0 /100 | #2 | Exceptional 1.3% |
| Norwegians | 100.0 /100 | #3 | Exceptional 1.3% |
| Germans | 100.0 /100 | #4 | Exceptional 1.4% |
| Slovenes | 100.0 /100 | #5 | Exceptional 1.4% |
| Carpatho Rusyns | 100.0 /100 | #6 | Exceptional 1.4% |
| English | 100.0 /100 | #7 | Exceptional 1.4% |
| Swedes | 100.0 /100 | #8 | Exceptional 1.4% |
| Scottish | 100.0 /100 | #9 | Exceptional 1.4% |
| Dutch | 100.0 /100 | #10 | Exceptional 1.4% |
| Lithuanians | 100.0 /100 | #11 | Exceptional 1.4% |
| Irish | 100.0 /100 | #12 | Exceptional 1.4% |
| Poles | 100.0 /100 | #13 | Exceptional 1.4% |
| Scotch-Irish | 100.0 /100 | #14 | Exceptional 1.5% |
| Tlingit-Haida | 100.0 /100 | #15 | Exceptional 1.5% |
Demographics Similar to Immigrants from Lithuania by No Schooling Completed
In terms of no schooling completed, the demographic groups most similar to Immigrants from Lithuania are Chickasaw (1.7%, a difference of 0.27%), Immigrants from Austria (1.7%, a difference of 0.75%), Canadian (1.7%, a difference of 0.94%), Serbian (1.7%, a difference of 1.1%), and New Zealander (1.7%, a difference of 1.1%).
| Demographics | Rating | Rank | No Schooling Completed |
| Tsimshian | 99.8 /100 | #61 | Exceptional 1.7% |
| Immigrants | Northern Europe | 99.8 /100 | #62 | Exceptional 1.7% |
| Russians | 99.8 /100 | #63 | Exceptional 1.7% |
| New Zealanders | 99.7 /100 | #64 | Exceptional 1.7% |
| Serbians | 99.7 /100 | #65 | Exceptional 1.7% |
| Canadians | 99.7 /100 | #66 | Exceptional 1.7% |
| Immigrants | Austria | 99.7 /100 | #67 | Exceptional 1.7% |
| Immigrants | Lithuania | 99.7 /100 | #68 | Exceptional 1.7% |
| Chickasaw | 99.6 /100 | #69 | Exceptional 1.7% |
| Immigrants | Netherlands | 99.6 /100 | #70 | Exceptional 1.7% |
| Immigrants | England | 99.5 /100 | #71 | Exceptional 1.7% |
| Cajuns | 99.5 /100 | #72 | Exceptional 1.7% |
| Immigrants | India | 99.4 /100 | #73 | Exceptional 1.7% |
| Zimbabweans | 99.4 /100 | #74 | Exceptional 1.7% |
| Immigrants | Belgium | 99.3 /100 | #75 | Exceptional 1.7% |