Laotian vs Immigrants from Lithuania No Schooling Completed
COMPARE
Laotian
Immigrants from Lithuania
No Schooling Completed
No Schooling Completed Comparison
Laotians
Immigrants from Lithuania
2.2%
NO SCHOOLING COMPLETED
13.3/ 100
METRIC RATING
203rd/ 347
METRIC RANK
1.7%
NO SCHOOLING COMPLETED
99.7/ 100
METRIC RATING
68th/ 347
METRIC RANK
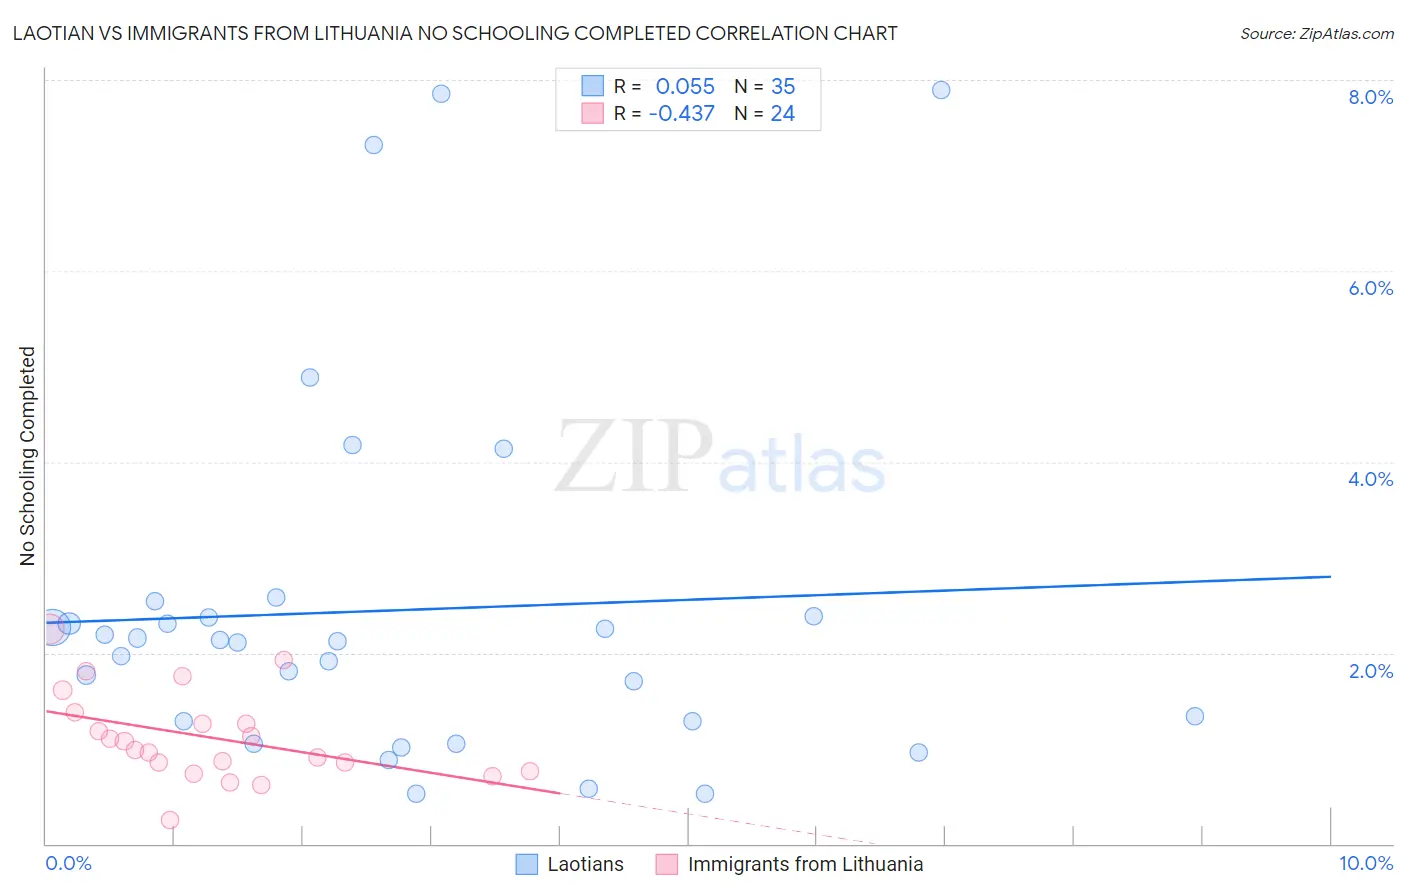
Laotian vs Immigrants from Lithuania No Schooling Completed Correlation Chart
The statistical analysis conducted on geographies consisting of 223,538,268 people shows a slight positive correlation between the proportion of Laotians and percentage of population with no schooling in the United States with a correlation coefficient (R) of 0.055 and weighted average of 2.2%. Similarly, the statistical analysis conducted on geographies consisting of 117,352,056 people shows a moderate negative correlation between the proportion of Immigrants from Lithuania and percentage of population with no schooling in the United States with a correlation coefficient (R) of -0.437 and weighted average of 1.7%, a difference of 31.5%.
No Schooling Completed Correlation Summary
| Measurement | Laotian | Immigrants from Lithuania |
| Minimum | 0.52% | 0.25% |
| Maximum | 7.9% | 2.2% |
| Range | 7.4% | 2.0% |
| Mean | 2.4% | 1.1% |
| Median | 2.1% | 1.0% |
| Interquartile 25% (IQ1) | 1.3% | 0.80% |
| Interquartile 75% (IQ3) | 2.4% | 1.3% |
| Interquartile Range (IQR) | 1.1% | 0.52% |
| Standard Deviation (Sample) | 1.9% | 0.47% |
| Standard Deviation (Population) | 1.9% | 0.46% |
Similar Demographics by No Schooling Completed
Demographics Similar to Laotians by No Schooling Completed
In terms of no schooling completed, the demographic groups most similar to Laotians are Moroccan (2.2%, a difference of 0.11%), Hopi (2.2%, a difference of 0.11%), Immigrants from Bahamas (2.2%, a difference of 0.51%), Bahamian (2.2%, a difference of 0.51%), and South American Indian (2.2%, a difference of 0.70%).
| Demographics | Rating | Rank | No Schooling Completed |
| Immigrants | Ukraine | 26.1 /100 | #196 | Fair 2.2% |
| Immigrants | Southern Europe | 23.8 /100 | #197 | Fair 2.2% |
| Immigrants | Chile | 22.7 /100 | #198 | Fair 2.2% |
| Africans | 21.8 /100 | #199 | Fair 2.2% |
| Immigrants | Northern Africa | 19.5 /100 | #200 | Poor 2.2% |
| Costa Ricans | 17.1 /100 | #201 | Poor 2.2% |
| Moroccans | 13.7 /100 | #202 | Poor 2.2% |
| Laotians | 13.3 /100 | #203 | Poor 2.2% |
| Hopi | 12.9 /100 | #204 | Poor 2.2% |
| Immigrants | Bahamas | 11.6 /100 | #205 | Poor 2.2% |
| Bahamians | 11.6 /100 | #206 | Poor 2.2% |
| South American Indians | 11.0 /100 | #207 | Poor 2.2% |
| Uruguayans | 11.0 /100 | #208 | Poor 2.2% |
| Immigrants | Oceania | 10.2 /100 | #209 | Poor 2.2% |
| Natives/Alaskans | 10.0 /100 | #210 | Tragic 2.2% |
Demographics Similar to Immigrants from Lithuania by No Schooling Completed
In terms of no schooling completed, the demographic groups most similar to Immigrants from Lithuania are Chickasaw (1.7%, a difference of 0.27%), Immigrants from Austria (1.7%, a difference of 0.75%), Canadian (1.7%, a difference of 0.94%), Serbian (1.7%, a difference of 1.1%), and New Zealander (1.7%, a difference of 1.1%).
| Demographics | Rating | Rank | No Schooling Completed |
| Tsimshian | 99.8 /100 | #61 | Exceptional 1.7% |
| Immigrants | Northern Europe | 99.8 /100 | #62 | Exceptional 1.7% |
| Russians | 99.8 /100 | #63 | Exceptional 1.7% |
| New Zealanders | 99.7 /100 | #64 | Exceptional 1.7% |
| Serbians | 99.7 /100 | #65 | Exceptional 1.7% |
| Canadians | 99.7 /100 | #66 | Exceptional 1.7% |
| Immigrants | Austria | 99.7 /100 | #67 | Exceptional 1.7% |
| Immigrants | Lithuania | 99.7 /100 | #68 | Exceptional 1.7% |
| Chickasaw | 99.6 /100 | #69 | Exceptional 1.7% |
| Immigrants | Netherlands | 99.6 /100 | #70 | Exceptional 1.7% |
| Immigrants | England | 99.5 /100 | #71 | Exceptional 1.7% |
| Cajuns | 99.5 /100 | #72 | Exceptional 1.7% |
| Immigrants | India | 99.4 /100 | #73 | Exceptional 1.7% |
| Zimbabweans | 99.4 /100 | #74 | Exceptional 1.7% |
| Immigrants | Belgium | 99.3 /100 | #75 | Exceptional 1.7% |