Norwegian vs Marshallese No Schooling Completed
COMPARE
Norwegian
Marshallese
No Schooling Completed
No Schooling Completed Comparison
Norwegians
Marshallese
1.3%
NO SCHOOLING COMPLETED
100.0/ 100
METRIC RATING
3rd/ 347
METRIC RANK
2.0%
NO SCHOOLING COMPLETED
83.5/ 100
METRIC RATING
140th/ 347
METRIC RANK
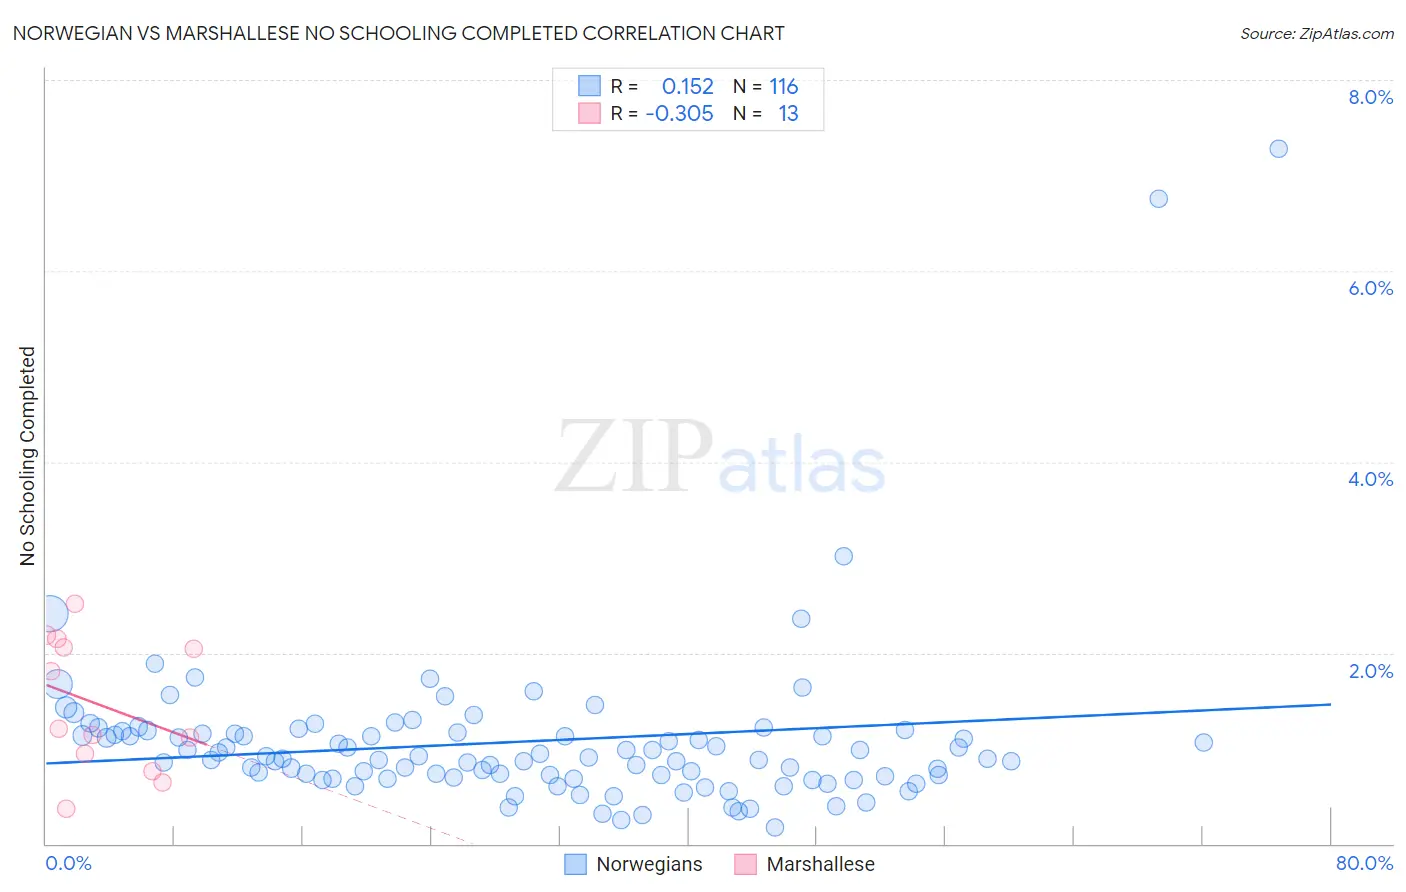
Norwegian vs Marshallese No Schooling Completed Correlation Chart
The statistical analysis conducted on geographies consisting of 518,592,582 people shows a poor positive correlation between the proportion of Norwegians and percentage of population with no schooling in the United States with a correlation coefficient (R) of 0.152 and weighted average of 1.3%. Similarly, the statistical analysis conducted on geographies consisting of 14,733,291 people shows a mild negative correlation between the proportion of Marshallese and percentage of population with no schooling in the United States with a correlation coefficient (R) of -0.305 and weighted average of 2.0%, a difference of 46.6%.
No Schooling Completed Correlation Summary
| Measurement | Norwegian | Marshallese |
| Minimum | 0.17% | 0.36% |
| Maximum | 7.3% | 2.5% |
| Range | 7.1% | 2.1% |
| Mean | 1.1% | 1.5% |
| Median | 0.89% | 1.2% |
| Interquartile 25% (IQ1) | 0.70% | 0.85% |
| Interquartile 75% (IQ3) | 1.2% | 2.1% |
| Interquartile Range (IQR) | 0.46% | 1.2% |
| Standard Deviation (Sample) | 0.90% | 0.70% |
| Standard Deviation (Population) | 0.90% | 0.67% |
Similar Demographics by No Schooling Completed
Demographics Similar to Norwegians by No Schooling Completed
In terms of no schooling completed, the demographic groups most similar to Norwegians are Slovak (1.3%, a difference of 0.43%), German (1.4%, a difference of 0.56%), Slovene (1.4%, a difference of 0.98%), Carpatho Rusyn (1.4%, a difference of 1.8%), and English (1.4%, a difference of 2.8%).
| Demographics | Rating | Rank | No Schooling Completed |
| Yup'ik | 100.0 /100 | #1 | Exceptional 1.2% |
| Slovaks | 100.0 /100 | #2 | Exceptional 1.3% |
| Norwegians | 100.0 /100 | #3 | Exceptional 1.3% |
| Germans | 100.0 /100 | #4 | Exceptional 1.4% |
| Slovenes | 100.0 /100 | #5 | Exceptional 1.4% |
| Carpatho Rusyns | 100.0 /100 | #6 | Exceptional 1.4% |
| English | 100.0 /100 | #7 | Exceptional 1.4% |
| Swedes | 100.0 /100 | #8 | Exceptional 1.4% |
| Scottish | 100.0 /100 | #9 | Exceptional 1.4% |
| Dutch | 100.0 /100 | #10 | Exceptional 1.4% |
| Lithuanians | 100.0 /100 | #11 | Exceptional 1.4% |
| Irish | 100.0 /100 | #12 | Exceptional 1.4% |
| Poles | 100.0 /100 | #13 | Exceptional 1.4% |
| Scotch-Irish | 100.0 /100 | #14 | Exceptional 1.5% |
| Tlingit-Haida | 100.0 /100 | #15 | Exceptional 1.5% |
Demographics Similar to Marshallese by No Schooling Completed
In terms of no schooling completed, the demographic groups most similar to Marshallese are Immigrants from Greece (2.0%, a difference of 0.010%), Jordanian (2.0%, a difference of 0.26%), Venezuelan (2.0%, a difference of 0.50%), Immigrants from Israel (2.0%, a difference of 0.51%), and Filipino (2.0%, a difference of 0.55%).
| Demographics | Rating | Rank | No Schooling Completed |
| Immigrants | Turkey | 90.2 /100 | #133 | Exceptional 1.9% |
| Menominee | 89.6 /100 | #134 | Excellent 1.9% |
| Hmong | 88.5 /100 | #135 | Excellent 1.9% |
| Burmese | 88.2 /100 | #136 | Excellent 1.9% |
| Filipinos | 85.5 /100 | #137 | Excellent 2.0% |
| Immigrants | Israel | 85.4 /100 | #138 | Excellent 2.0% |
| Jordanians | 84.5 /100 | #139 | Excellent 2.0% |
| Marshallese | 83.5 /100 | #140 | Excellent 2.0% |
| Immigrants | Greece | 83.5 /100 | #141 | Excellent 2.0% |
| Venezuelans | 81.5 /100 | #142 | Excellent 2.0% |
| Immigrants | South Central Asia | 80.0 /100 | #143 | Good 2.0% |
| Alsatians | 79.1 /100 | #144 | Good 2.0% |
| Immigrants | Iran | 79.0 /100 | #145 | Good 2.0% |
| Immigrants | Moldova | 78.0 /100 | #146 | Good 2.0% |
| Soviet Union | 77.1 /100 | #147 | Good 2.0% |