Taiwanese vs Immigrants from Lithuania No Schooling Completed
COMPARE
Taiwanese
Immigrants from Lithuania
No Schooling Completed
No Schooling Completed Comparison
Taiwanese
Immigrants from Lithuania
2.5%
NO SCHOOLING COMPLETED
0.3/ 100
METRIC RATING
268th/ 347
METRIC RANK
1.7%
NO SCHOOLING COMPLETED
99.7/ 100
METRIC RATING
68th/ 347
METRIC RANK
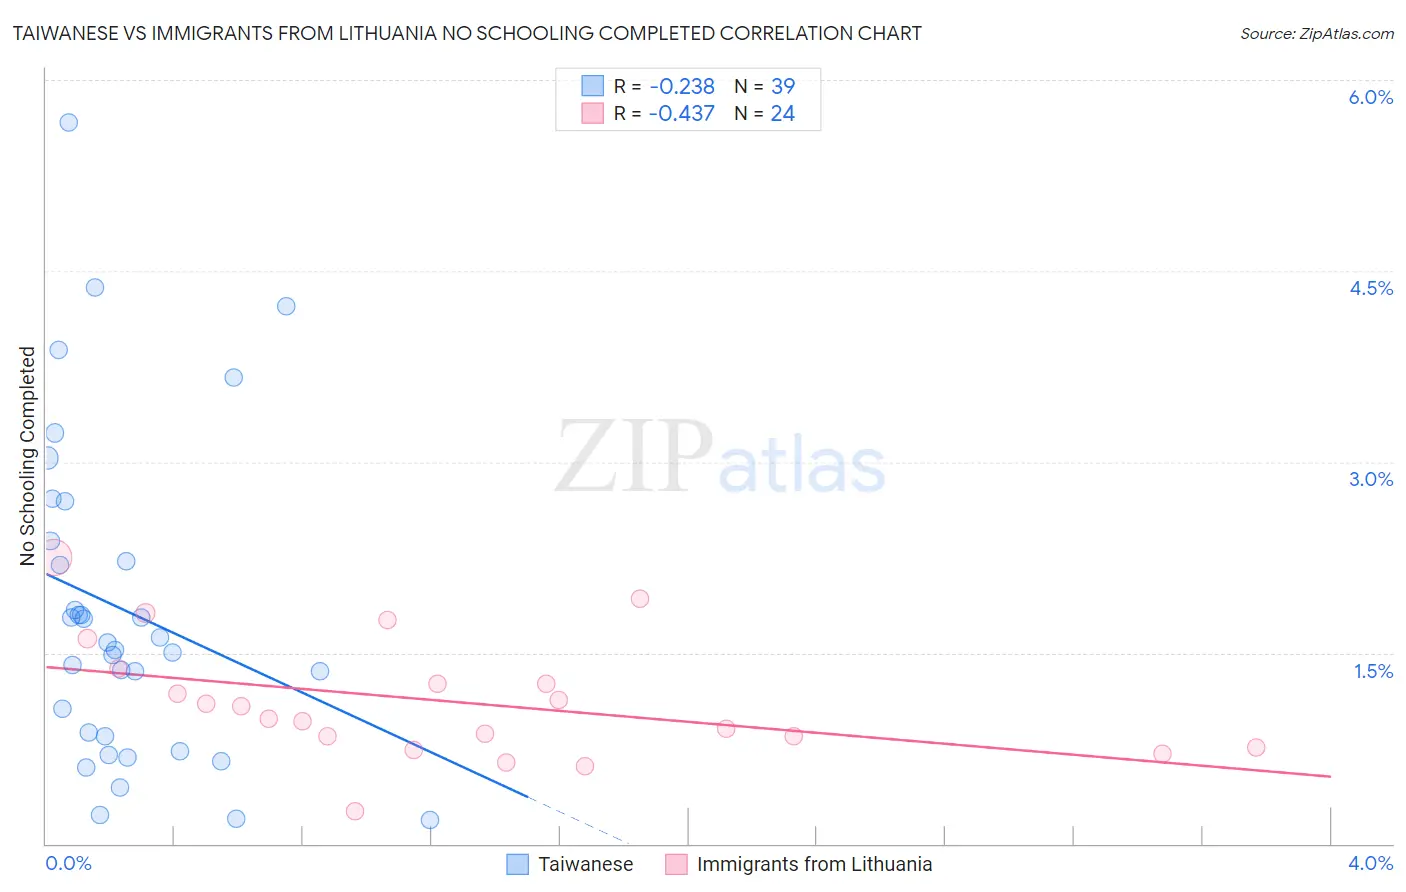
Taiwanese vs Immigrants from Lithuania No Schooling Completed Correlation Chart
The statistical analysis conducted on geographies consisting of 31,647,627 people shows a weak negative correlation between the proportion of Taiwanese and percentage of population with no schooling in the United States with a correlation coefficient (R) of -0.238 and weighted average of 2.5%. Similarly, the statistical analysis conducted on geographies consisting of 117,352,056 people shows a moderate negative correlation between the proportion of Immigrants from Lithuania and percentage of population with no schooling in the United States with a correlation coefficient (R) of -0.437 and weighted average of 1.7%, a difference of 47.4%.
No Schooling Completed Correlation Summary
| Measurement | Taiwanese | Immigrants from Lithuania |
| Minimum | 0.18% | 0.25% |
| Maximum | 5.7% | 2.2% |
| Range | 5.5% | 2.0% |
| Mean | 1.8% | 1.1% |
| Median | 1.6% | 1.0% |
| Interquartile 25% (IQ1) | 0.84% | 0.80% |
| Interquartile 75% (IQ3) | 2.4% | 1.3% |
| Interquartile Range (IQR) | 1.5% | 0.52% |
| Standard Deviation (Sample) | 1.3% | 0.47% |
| Standard Deviation (Population) | 1.2% | 0.46% |
Similar Demographics by No Schooling Completed
Demographics Similar to Taiwanese by No Schooling Completed
In terms of no schooling completed, the demographic groups most similar to Taiwanese are Yuman (2.5%, a difference of 0.26%), Fijian (2.5%, a difference of 0.44%), West Indian (2.5%, a difference of 0.51%), Indian (Asian) (2.5%, a difference of 0.70%), and Immigrants from Liberia (2.5%, a difference of 0.83%).
| Demographics | Rating | Rank | No Schooling Completed |
| Armenians | 0.5 /100 | #261 | Tragic 2.5% |
| Immigrants | Sierra Leone | 0.5 /100 | #262 | Tragic 2.5% |
| Immigrants | Liberia | 0.4 /100 | #263 | Tragic 2.5% |
| Indians (Asian) | 0.4 /100 | #264 | Tragic 2.5% |
| West Indians | 0.4 /100 | #265 | Tragic 2.5% |
| Fijians | 0.4 /100 | #266 | Tragic 2.5% |
| Yuman | 0.4 /100 | #267 | Tragic 2.5% |
| Taiwanese | 0.3 /100 | #268 | Tragic 2.5% |
| Immigrants | Nigeria | 0.2 /100 | #269 | Tragic 2.5% |
| Immigrants | Peru | 0.2 /100 | #270 | Tragic 2.5% |
| Cubans | 0.2 /100 | #271 | Tragic 2.5% |
| Immigrants | Bolivia | 0.2 /100 | #272 | Tragic 2.5% |
| Immigrants | Cameroon | 0.1 /100 | #273 | Tragic 2.5% |
| Ghanaians | 0.1 /100 | #274 | Tragic 2.6% |
| Immigrants | China | 0.1 /100 | #275 | Tragic 2.6% |
Demographics Similar to Immigrants from Lithuania by No Schooling Completed
In terms of no schooling completed, the demographic groups most similar to Immigrants from Lithuania are Chickasaw (1.7%, a difference of 0.27%), Immigrants from Austria (1.7%, a difference of 0.75%), Canadian (1.7%, a difference of 0.94%), Serbian (1.7%, a difference of 1.1%), and New Zealander (1.7%, a difference of 1.1%).
| Demographics | Rating | Rank | No Schooling Completed |
| Tsimshian | 99.8 /100 | #61 | Exceptional 1.7% |
| Immigrants | Northern Europe | 99.8 /100 | #62 | Exceptional 1.7% |
| Russians | 99.8 /100 | #63 | Exceptional 1.7% |
| New Zealanders | 99.7 /100 | #64 | Exceptional 1.7% |
| Serbians | 99.7 /100 | #65 | Exceptional 1.7% |
| Canadians | 99.7 /100 | #66 | Exceptional 1.7% |
| Immigrants | Austria | 99.7 /100 | #67 | Exceptional 1.7% |
| Immigrants | Lithuania | 99.7 /100 | #68 | Exceptional 1.7% |
| Chickasaw | 99.6 /100 | #69 | Exceptional 1.7% |
| Immigrants | Netherlands | 99.6 /100 | #70 | Exceptional 1.7% |
| Immigrants | England | 99.5 /100 | #71 | Exceptional 1.7% |
| Cajuns | 99.5 /100 | #72 | Exceptional 1.7% |
| Immigrants | India | 99.4 /100 | #73 | Exceptional 1.7% |
| Zimbabweans | 99.4 /100 | #74 | Exceptional 1.7% |
| Immigrants | Belgium | 99.3 /100 | #75 | Exceptional 1.7% |