Norwegian vs Immigrants from Lithuania 1 or more Vehicles in Household
COMPARE
Norwegian
Immigrants from Lithuania
1 or more Vehicles in Household
1 or more Vehicles in Household Comparison
Norwegians
Immigrants from Lithuania
93.7%
1 OR MORE VEHICLES IN HOUSEHOLD
100.0/ 100
METRIC RATING
3rd/ 347
METRIC RANK
90.2%
1 OR MORE VEHICLES IN HOUSEHOLD
83.0/ 100
METRIC RATING
142nd/ 347
METRIC RANK
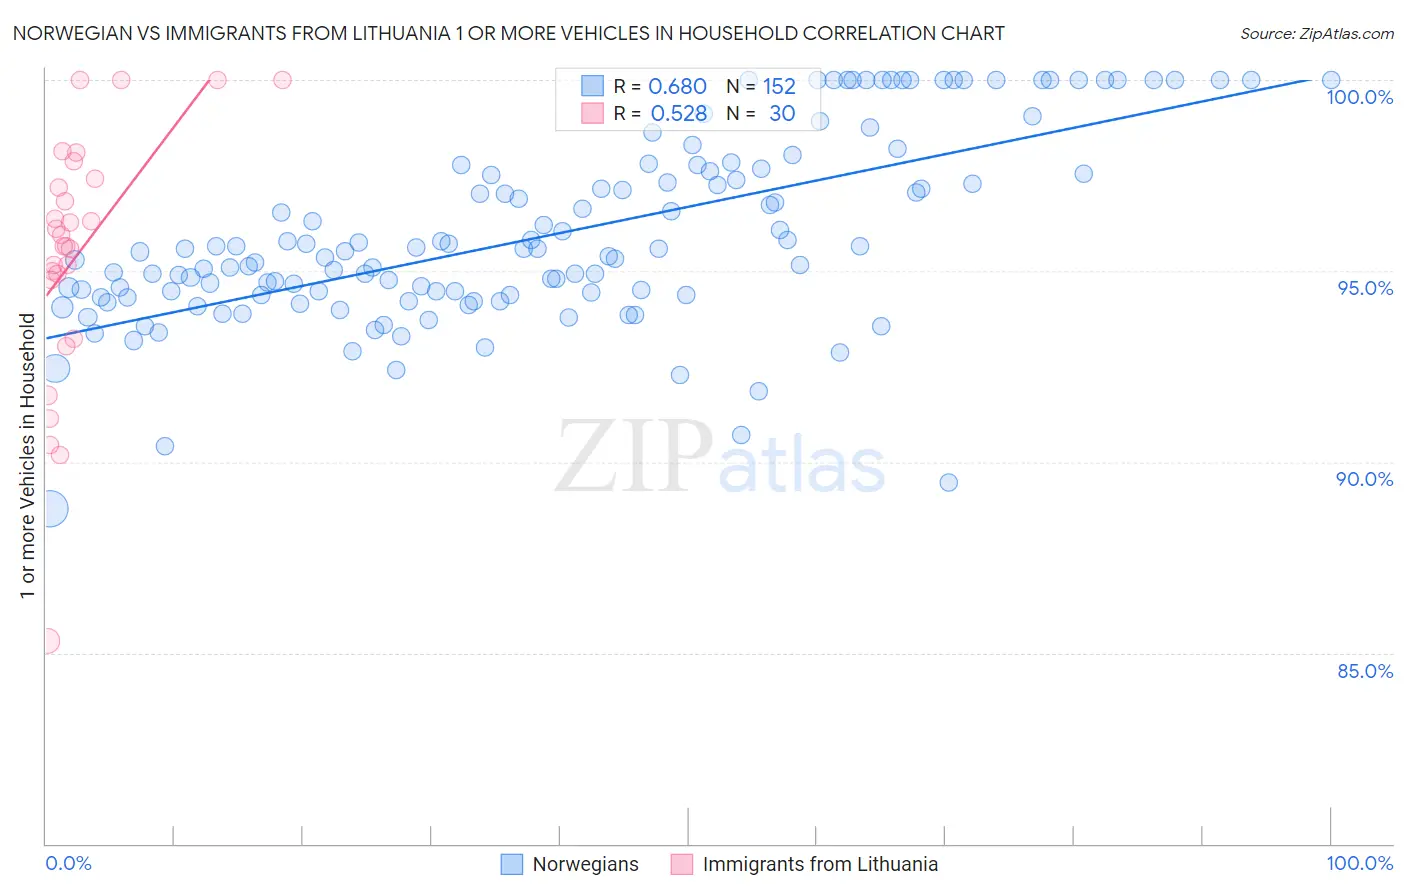
Norwegian vs Immigrants from Lithuania 1 or more Vehicles in Household Correlation Chart
The statistical analysis conducted on geographies consisting of 532,998,902 people shows a significant positive correlation between the proportion of Norwegians and percentage of households with 1 or more vehicles available in the United States with a correlation coefficient (R) of 0.680 and weighted average of 93.7%. Similarly, the statistical analysis conducted on geographies consisting of 117,713,976 people shows a substantial positive correlation between the proportion of Immigrants from Lithuania and percentage of households with 1 or more vehicles available in the United States with a correlation coefficient (R) of 0.528 and weighted average of 90.2%, a difference of 3.8%.
1 or more Vehicles in Household Correlation Summary
| Measurement | Norwegian | Immigrants from Lithuania |
| Minimum | 88.8% | 85.3% |
| Maximum | 100.0% | 100.0% |
| Range | 11.2% | 14.7% |
| Mean | 95.9% | 95.4% |
| Median | 95.5% | 95.8% |
| Interquartile 25% (IQ1) | 94.4% | 94.8% |
| Interquartile 75% (IQ3) | 97.6% | 97.4% |
| Interquartile Range (IQR) | 3.2% | 2.6% |
| Standard Deviation (Sample) | 2.4% | 3.3% |
| Standard Deviation (Population) | 2.4% | 3.2% |
Similar Demographics by 1 or more Vehicles in Household
Demographics Similar to Norwegians by 1 or more Vehicles in Household
In terms of 1 or more vehicles in household, the demographic groups most similar to Norwegians are German (93.6%, a difference of 0.050%), English (93.8%, a difference of 0.13%), Yakama (93.6%, a difference of 0.14%), Danish (93.5%, a difference of 0.16%), and Scottish (93.4%, a difference of 0.35%).
| Demographics | Rating | Rank | 1 or more Vehicles in Household |
| Luxembourgers | 100.0 /100 | #1 | Exceptional 94.8% |
| English | 100.0 /100 | #2 | Exceptional 93.8% |
| Norwegians | 100.0 /100 | #3 | Exceptional 93.7% |
| Germans | 100.0 /100 | #4 | Exceptional 93.6% |
| Yakama | 100.0 /100 | #5 | Exceptional 93.6% |
| Danes | 100.0 /100 | #6 | Exceptional 93.5% |
| Scottish | 100.0 /100 | #7 | Exceptional 93.4% |
| Swedes | 100.0 /100 | #8 | Exceptional 93.3% |
| Scotch-Irish | 100.0 /100 | #9 | Exceptional 93.3% |
| Dutch | 100.0 /100 | #10 | Exceptional 93.3% |
| Czechs | 100.0 /100 | #11 | Exceptional 93.3% |
| Scandinavians | 100.0 /100 | #12 | Exceptional 93.1% |
| Whites/Caucasians | 100.0 /100 | #13 | Exceptional 93.1% |
| Irish | 100.0 /100 | #14 | Exceptional 93.1% |
| Mexicans | 100.0 /100 | #15 | Exceptional 93.0% |
Demographics Similar to Immigrants from Lithuania by 1 or more Vehicles in Household
In terms of 1 or more vehicles in household, the demographic groups most similar to Immigrants from Lithuania are Immigrants from Moldova (90.2%, a difference of 0.0%), Immigrants from Bahamas (90.2%, a difference of 0.040%), Immigrants from Zimbabwe (90.2%, a difference of 0.040%), Sioux (90.2%, a difference of 0.040%), and Sudanese (90.3%, a difference of 0.060%).
| Demographics | Rating | Rank | 1 or more Vehicles in Household |
| Immigrants | Oceania | 86.9 /100 | #135 | Excellent 90.4% |
| Hungarians | 86.5 /100 | #136 | Excellent 90.3% |
| Latvians | 86.3 /100 | #137 | Excellent 90.3% |
| Syrians | 86.3 /100 | #138 | Excellent 90.3% |
| Estonians | 85.6 /100 | #139 | Excellent 90.3% |
| Sudanese | 85.2 /100 | #140 | Excellent 90.3% |
| Immigrants | Moldova | 83.1 /100 | #141 | Excellent 90.2% |
| Immigrants | Lithuania | 83.0 /100 | #142 | Excellent 90.2% |
| Immigrants | Bahamas | 81.5 /100 | #143 | Excellent 90.2% |
| Immigrants | Zimbabwe | 81.5 /100 | #144 | Excellent 90.2% |
| Sioux | 81.3 /100 | #145 | Excellent 90.2% |
| Bahamians | 80.5 /100 | #146 | Excellent 90.2% |
| Chileans | 79.8 /100 | #147 | Good 90.2% |
| Immigrants | Eastern Africa | 78.2 /100 | #148 | Good 90.1% |
| Immigrants | Nicaragua | 76.7 /100 | #149 | Good 90.1% |