Norwegian vs Alaska Native No Schooling Completed
COMPARE
Norwegian
Alaska Native
No Schooling Completed
No Schooling Completed Comparison
Norwegians
Alaska Natives
1.3%
NO SCHOOLING COMPLETED
100.0/ 100
METRIC RATING
3rd/ 347
METRIC RANK
1.5%
NO SCHOOLING COMPLETED
100.0/ 100
METRIC RATING
22nd/ 347
METRIC RANK
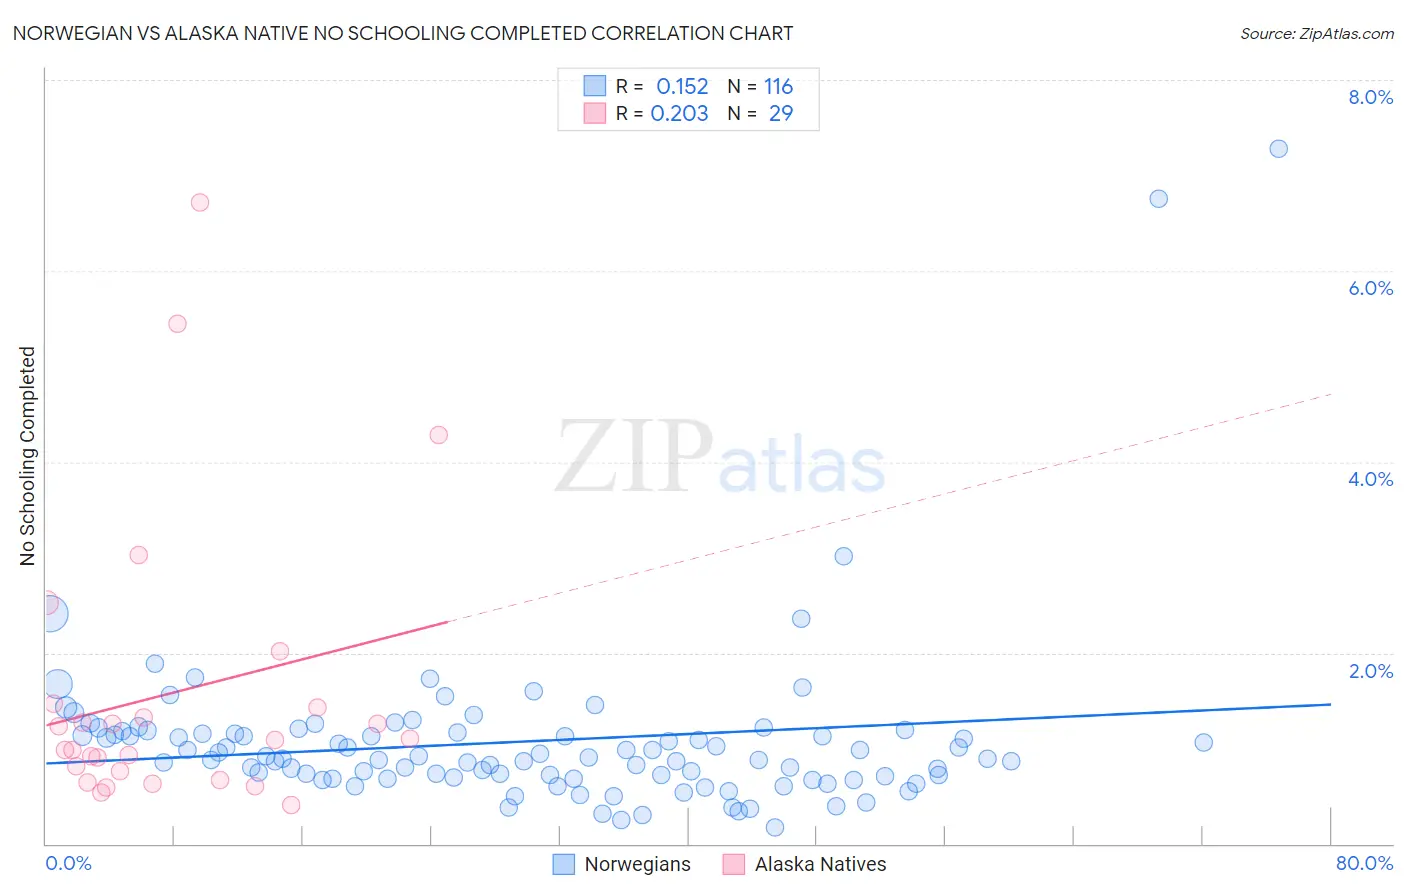
Norwegian vs Alaska Native No Schooling Completed Correlation Chart
The statistical analysis conducted on geographies consisting of 518,592,582 people shows a poor positive correlation between the proportion of Norwegians and percentage of population with no schooling in the United States with a correlation coefficient (R) of 0.152 and weighted average of 1.3%. Similarly, the statistical analysis conducted on geographies consisting of 76,332,603 people shows a weak positive correlation between the proportion of Alaska Natives and percentage of population with no schooling in the United States with a correlation coefficient (R) of 0.203 and weighted average of 1.5%, a difference of 9.3%.
No Schooling Completed Correlation Summary
| Measurement | Norwegian | Alaska Native |
| Minimum | 0.17% | 0.40% |
| Maximum | 7.3% | 6.7% |
| Range | 7.1% | 6.3% |
| Mean | 1.1% | 1.6% |
| Median | 0.89% | 1.1% |
| Interquartile 25% (IQ1) | 0.70% | 0.71% |
| Interquartile 75% (IQ3) | 1.2% | 1.4% |
| Interquartile Range (IQR) | 0.46% | 0.74% |
| Standard Deviation (Sample) | 0.90% | 1.5% |
| Standard Deviation (Population) | 0.90% | 1.5% |
Demographics Similar to Norwegians and Alaska Natives by No Schooling Completed
In terms of no schooling completed, the demographic groups most similar to Norwegians are Slovak (1.3%, a difference of 0.43%), German (1.4%, a difference of 0.56%), Slovene (1.4%, a difference of 0.98%), Carpatho Rusyn (1.4%, a difference of 1.8%), and English (1.4%, a difference of 2.8%). Similarly, the demographic groups most similar to Alaska Natives are Chinese (1.5%, a difference of 0.090%), Welsh (1.5%, a difference of 0.46%), Alaskan Athabascan (1.5%, a difference of 0.58%), Danish (1.5%, a difference of 0.69%), and Croatian (1.5%, a difference of 0.99%).
| Demographics | Rating | Rank | No Schooling Completed |
| Slovaks | 100.0 /100 | #2 | Exceptional 1.3% |
| Norwegians | 100.0 /100 | #3 | Exceptional 1.3% |
| Germans | 100.0 /100 | #4 | Exceptional 1.4% |
| Slovenes | 100.0 /100 | #5 | Exceptional 1.4% |
| Carpatho Rusyns | 100.0 /100 | #6 | Exceptional 1.4% |
| English | 100.0 /100 | #7 | Exceptional 1.4% |
| Swedes | 100.0 /100 | #8 | Exceptional 1.4% |
| Scottish | 100.0 /100 | #9 | Exceptional 1.4% |
| Dutch | 100.0 /100 | #10 | Exceptional 1.4% |
| Lithuanians | 100.0 /100 | #11 | Exceptional 1.4% |
| Irish | 100.0 /100 | #12 | Exceptional 1.4% |
| Poles | 100.0 /100 | #13 | Exceptional 1.4% |
| Scotch-Irish | 100.0 /100 | #14 | Exceptional 1.5% |
| Tlingit-Haida | 100.0 /100 | #15 | Exceptional 1.5% |
| Finns | 100.0 /100 | #16 | Exceptional 1.5% |
| Croatians | 100.0 /100 | #17 | Exceptional 1.5% |
| Danes | 100.0 /100 | #18 | Exceptional 1.5% |
| Alaskan Athabascans | 100.0 /100 | #19 | Exceptional 1.5% |
| Welsh | 100.0 /100 | #20 | Exceptional 1.5% |
| Chinese | 100.0 /100 | #21 | Exceptional 1.5% |
| Alaska Natives | 100.0 /100 | #22 | Exceptional 1.5% |