Norwegian vs Immigrants from Uruguay No Schooling Completed
COMPARE
Norwegian
Immigrants from Uruguay
No Schooling Completed
No Schooling Completed Comparison
Norwegians
Immigrants from Uruguay
1.3%
NO SCHOOLING COMPLETED
100.0/ 100
METRIC RATING
3rd/ 347
METRIC RANK
2.3%
NO SCHOOLING COMPLETED
3.4/ 100
METRIC RATING
231st/ 347
METRIC RANK
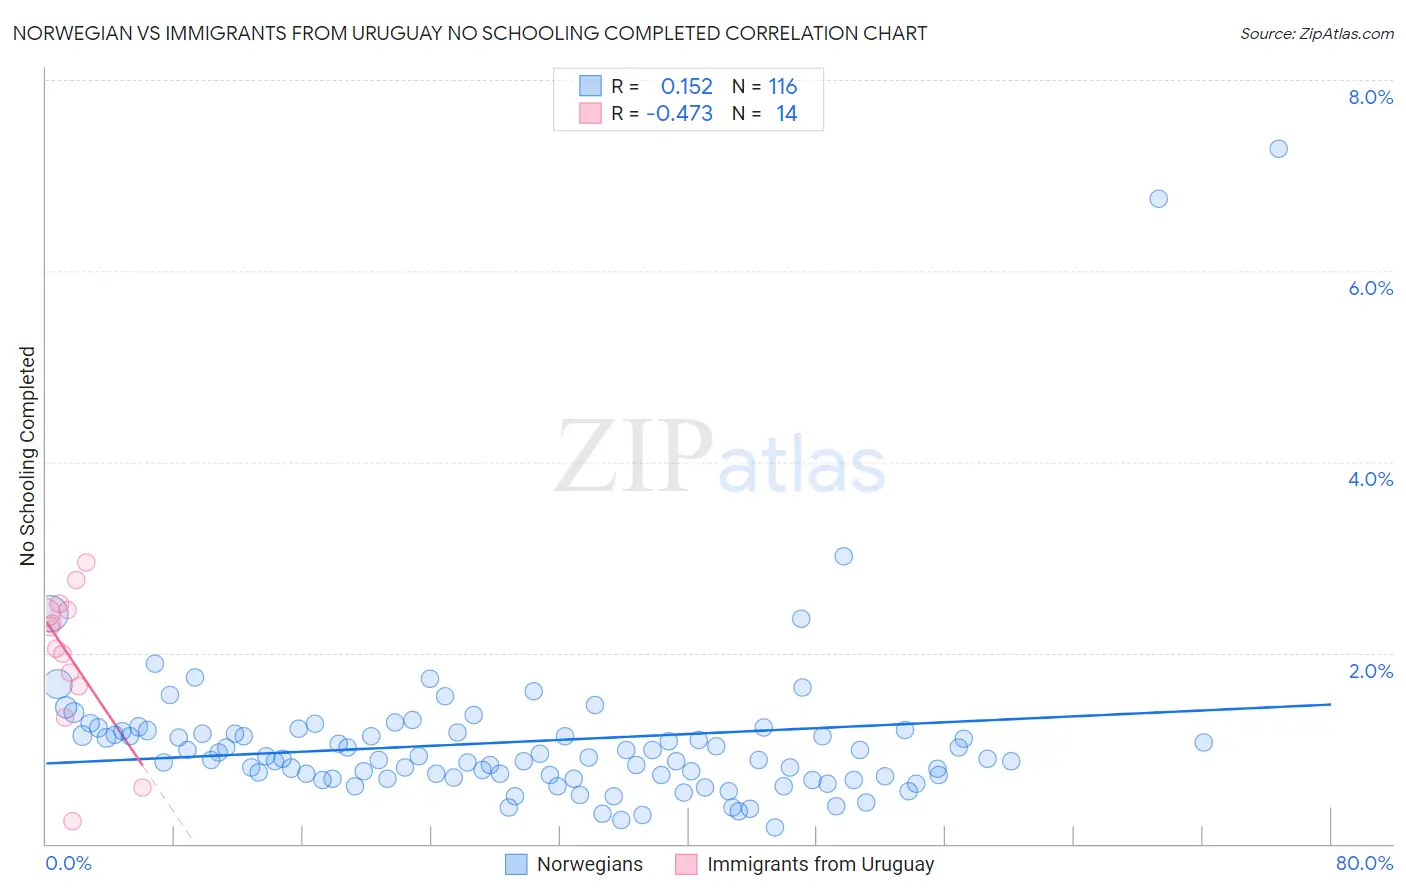
Norwegian vs Immigrants from Uruguay No Schooling Completed Correlation Chart
The statistical analysis conducted on geographies consisting of 518,592,582 people shows a poor positive correlation between the proportion of Norwegians and percentage of population with no schooling in the United States with a correlation coefficient (R) of 0.152 and weighted average of 1.3%. Similarly, the statistical analysis conducted on geographies consisting of 132,928,129 people shows a moderate negative correlation between the proportion of Immigrants from Uruguay and percentage of population with no schooling in the United States with a correlation coefficient (R) of -0.473 and weighted average of 2.3%, a difference of 72.5%.
No Schooling Completed Correlation Summary
| Measurement | Norwegian | Immigrants from Uruguay |
| Minimum | 0.17% | 0.24% |
| Maximum | 7.3% | 2.9% |
| Range | 7.1% | 2.7% |
| Mean | 1.1% | 2.0% |
| Median | 0.89% | 2.2% |
| Interquartile 25% (IQ1) | 0.70% | 1.7% |
| Interquartile 75% (IQ3) | 1.2% | 2.5% |
| Interquartile Range (IQR) | 0.46% | 0.80% |
| Standard Deviation (Sample) | 0.90% | 0.78% |
| Standard Deviation (Population) | 0.90% | 0.75% |
Similar Demographics by No Schooling Completed
Demographics Similar to Norwegians by No Schooling Completed
In terms of no schooling completed, the demographic groups most similar to Norwegians are Slovak (1.3%, a difference of 0.43%), German (1.4%, a difference of 0.56%), Slovene (1.4%, a difference of 0.98%), Carpatho Rusyn (1.4%, a difference of 1.8%), and English (1.4%, a difference of 2.8%).
| Demographics | Rating | Rank | No Schooling Completed |
| Yup'ik | 100.0 /100 | #1 | Exceptional 1.2% |
| Slovaks | 100.0 /100 | #2 | Exceptional 1.3% |
| Norwegians | 100.0 /100 | #3 | Exceptional 1.3% |
| Germans | 100.0 /100 | #4 | Exceptional 1.4% |
| Slovenes | 100.0 /100 | #5 | Exceptional 1.4% |
| Carpatho Rusyns | 100.0 /100 | #6 | Exceptional 1.4% |
| English | 100.0 /100 | #7 | Exceptional 1.4% |
| Swedes | 100.0 /100 | #8 | Exceptional 1.4% |
| Scottish | 100.0 /100 | #9 | Exceptional 1.4% |
| Dutch | 100.0 /100 | #10 | Exceptional 1.4% |
| Lithuanians | 100.0 /100 | #11 | Exceptional 1.4% |
| Irish | 100.0 /100 | #12 | Exceptional 1.4% |
| Poles | 100.0 /100 | #13 | Exceptional 1.4% |
| Scotch-Irish | 100.0 /100 | #14 | Exceptional 1.5% |
| Tlingit-Haida | 100.0 /100 | #15 | Exceptional 1.5% |
Demographics Similar to Immigrants from Uruguay by No Schooling Completed
In terms of no schooling completed, the demographic groups most similar to Immigrants from Uruguay are Puerto Rican (2.3%, a difference of 0.020%), Immigrants from Pakistan (2.3%, a difference of 0.16%), Colombian (2.3%, a difference of 0.22%), U.S. Virgin Islander (2.3%, a difference of 0.24%), and Immigrants from Uganda (2.3%, a difference of 0.53%).
| Demographics | Rating | Rank | No Schooling Completed |
| Tohono O'odham | 4.1 /100 | #224 | Tragic 2.3% |
| Sudanese | 4.1 /100 | #225 | Tragic 2.3% |
| Sierra Leoneans | 4.1 /100 | #226 | Tragic 2.3% |
| Immigrants | Uganda | 4.0 /100 | #227 | Tragic 2.3% |
| U.S. Virgin Islanders | 3.7 /100 | #228 | Tragic 2.3% |
| Immigrants | Pakistan | 3.6 /100 | #229 | Tragic 2.3% |
| Puerto Ricans | 3.4 /100 | #230 | Tragic 2.3% |
| Immigrants | Uruguay | 3.4 /100 | #231 | Tragic 2.3% |
| Colombians | 3.2 /100 | #232 | Tragic 2.3% |
| Immigrants | Malaysia | 2.8 /100 | #233 | Tragic 2.3% |
| Nigerians | 2.6 /100 | #234 | Tragic 2.3% |
| Immigrants | Western Asia | 2.6 /100 | #235 | Tragic 2.3% |
| Iraqis | 2.2 /100 | #236 | Tragic 2.4% |
| Immigrants | Eastern Asia | 2.0 /100 | #237 | Tragic 2.4% |
| Paiute | 1.9 /100 | #238 | Tragic 2.4% |