Norwegian vs Sri Lankan No Schooling Completed
COMPARE
Norwegian
Sri Lankan
No Schooling Completed
No Schooling Completed Comparison
Norwegians
Sri Lankans
1.3%
NO SCHOOLING COMPLETED
100.0/ 100
METRIC RATING
3rd/ 347
METRIC RANK
3.0%
NO SCHOOLING COMPLETED
0.0/ 100
METRIC RATING
312th/ 347
METRIC RANK
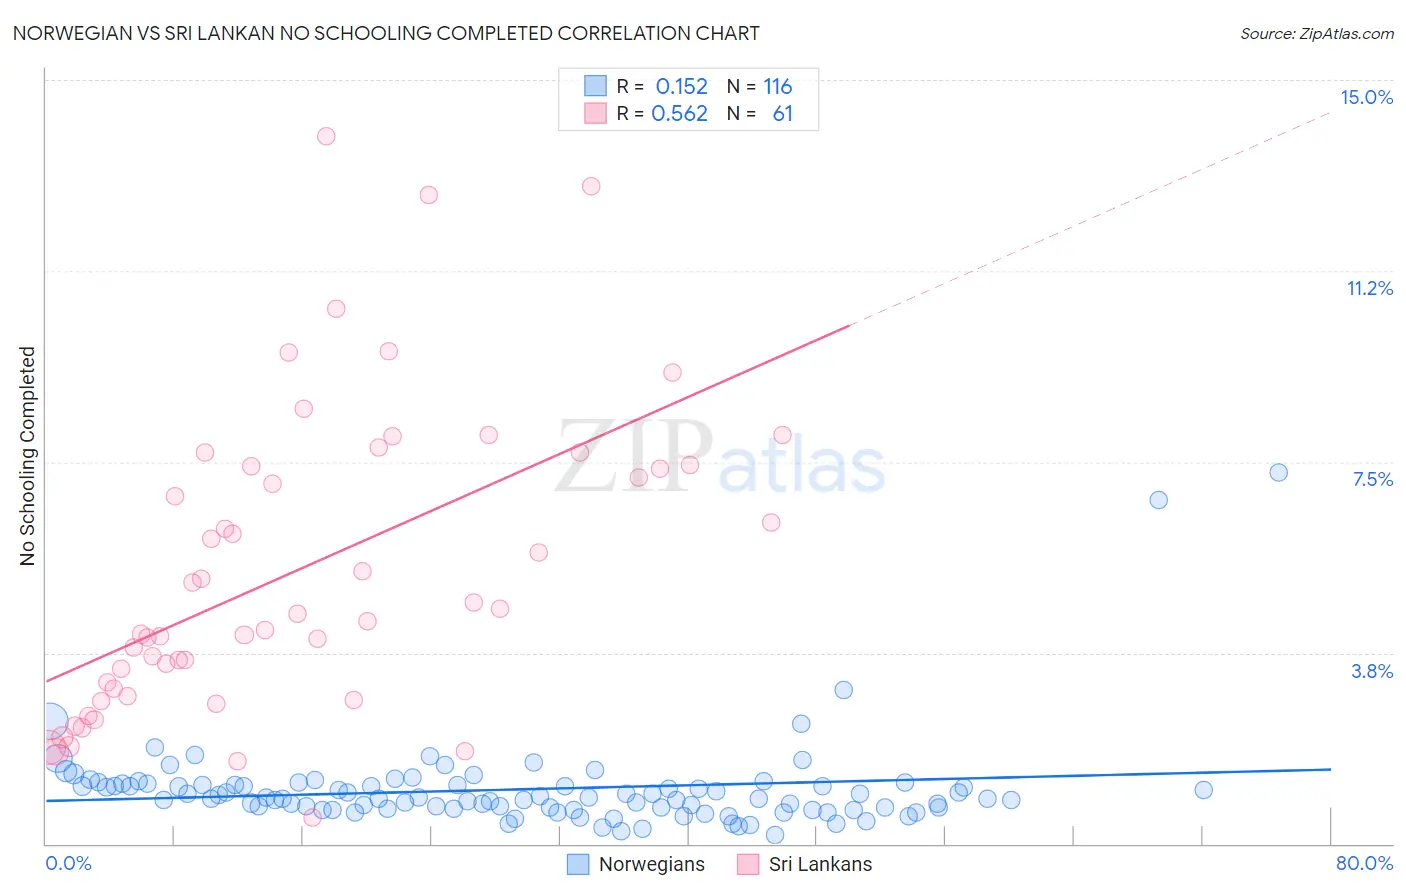
Norwegian vs Sri Lankan No Schooling Completed Correlation Chart
The statistical analysis conducted on geographies consisting of 518,592,582 people shows a poor positive correlation between the proportion of Norwegians and percentage of population with no schooling in the United States with a correlation coefficient (R) of 0.152 and weighted average of 1.3%. Similarly, the statistical analysis conducted on geographies consisting of 436,055,968 people shows a substantial positive correlation between the proportion of Sri Lankans and percentage of population with no schooling in the United States with a correlation coefficient (R) of 0.562 and weighted average of 3.0%, a difference of 126.1%.
No Schooling Completed Correlation Summary
| Measurement | Norwegian | Sri Lankan |
| Minimum | 0.17% | 0.51% |
| Maximum | 7.3% | 13.9% |
| Range | 7.1% | 13.4% |
| Mean | 1.1% | 5.4% |
| Median | 0.89% | 4.5% |
| Interquartile 25% (IQ1) | 0.70% | 3.0% |
| Interquartile 75% (IQ3) | 1.2% | 7.4% |
| Interquartile Range (IQR) | 0.46% | 4.5% |
| Standard Deviation (Sample) | 0.90% | 3.0% |
| Standard Deviation (Population) | 0.90% | 3.0% |
Similar Demographics by No Schooling Completed
Demographics Similar to Norwegians by No Schooling Completed
In terms of no schooling completed, the demographic groups most similar to Norwegians are Slovak (1.3%, a difference of 0.43%), German (1.4%, a difference of 0.56%), Slovene (1.4%, a difference of 0.98%), Carpatho Rusyn (1.4%, a difference of 1.8%), and English (1.4%, a difference of 2.8%).
| Demographics | Rating | Rank | No Schooling Completed |
| Yup'ik | 100.0 /100 | #1 | Exceptional 1.2% |
| Slovaks | 100.0 /100 | #2 | Exceptional 1.3% |
| Norwegians | 100.0 /100 | #3 | Exceptional 1.3% |
| Germans | 100.0 /100 | #4 | Exceptional 1.4% |
| Slovenes | 100.0 /100 | #5 | Exceptional 1.4% |
| Carpatho Rusyns | 100.0 /100 | #6 | Exceptional 1.4% |
| English | 100.0 /100 | #7 | Exceptional 1.4% |
| Swedes | 100.0 /100 | #8 | Exceptional 1.4% |
| Scottish | 100.0 /100 | #9 | Exceptional 1.4% |
| Dutch | 100.0 /100 | #10 | Exceptional 1.4% |
| Lithuanians | 100.0 /100 | #11 | Exceptional 1.4% |
| Irish | 100.0 /100 | #12 | Exceptional 1.4% |
| Poles | 100.0 /100 | #13 | Exceptional 1.4% |
| Scotch-Irish | 100.0 /100 | #14 | Exceptional 1.5% |
| Tlingit-Haida | 100.0 /100 | #15 | Exceptional 1.5% |
Demographics Similar to Sri Lankans by No Schooling Completed
In terms of no schooling completed, the demographic groups most similar to Sri Lankans are Immigrants from the Azores (3.0%, a difference of 0.28%), Guyanese (3.0%, a difference of 0.38%), Hispanic or Latino (3.0%, a difference of 0.43%), Honduran (3.1%, a difference of 0.51%), and Immigrants from Belize (3.1%, a difference of 0.60%).
| Demographics | Rating | Rank | No Schooling Completed |
| Ecuadorians | 0.0 /100 | #305 | Tragic 3.0% |
| Belizeans | 0.0 /100 | #306 | Tragic 3.0% |
| Immigrants | Haiti | 0.0 /100 | #307 | Tragic 3.0% |
| Immigrants | Somalia | 0.0 /100 | #308 | Tragic 3.0% |
| Hispanics or Latinos | 0.0 /100 | #309 | Tragic 3.0% |
| Guyanese | 0.0 /100 | #310 | Tragic 3.0% |
| Immigrants | Azores | 0.0 /100 | #311 | Tragic 3.0% |
| Sri Lankans | 0.0 /100 | #312 | Tragic 3.0% |
| Hondurans | 0.0 /100 | #313 | Tragic 3.1% |
| Immigrants | Belize | 0.0 /100 | #314 | Tragic 3.1% |
| Immigrants | Nicaragua | 0.0 /100 | #315 | Tragic 3.1% |
| Immigrants | Ecuador | 0.0 /100 | #316 | Tragic 3.1% |
| Cape Verdeans | 0.0 /100 | #317 | Tragic 3.1% |
| Immigrants | Guyana | 0.0 /100 | #318 | Tragic 3.1% |
| Immigrants | Burma/Myanmar | 0.0 /100 | #319 | Tragic 3.1% |