Immigrants from Burma/Myanmar vs Immigrants from Lithuania No Schooling Completed
COMPARE
Immigrants from Burma/Myanmar
Immigrants from Lithuania
No Schooling Completed
No Schooling Completed Comparison
Immigrants from Burma/Myanmar
Immigrants from Lithuania
3.1%
NO SCHOOLING COMPLETED
0.0/ 100
METRIC RATING
319th/ 347
METRIC RANK
1.7%
NO SCHOOLING COMPLETED
99.7/ 100
METRIC RATING
68th/ 347
METRIC RANK
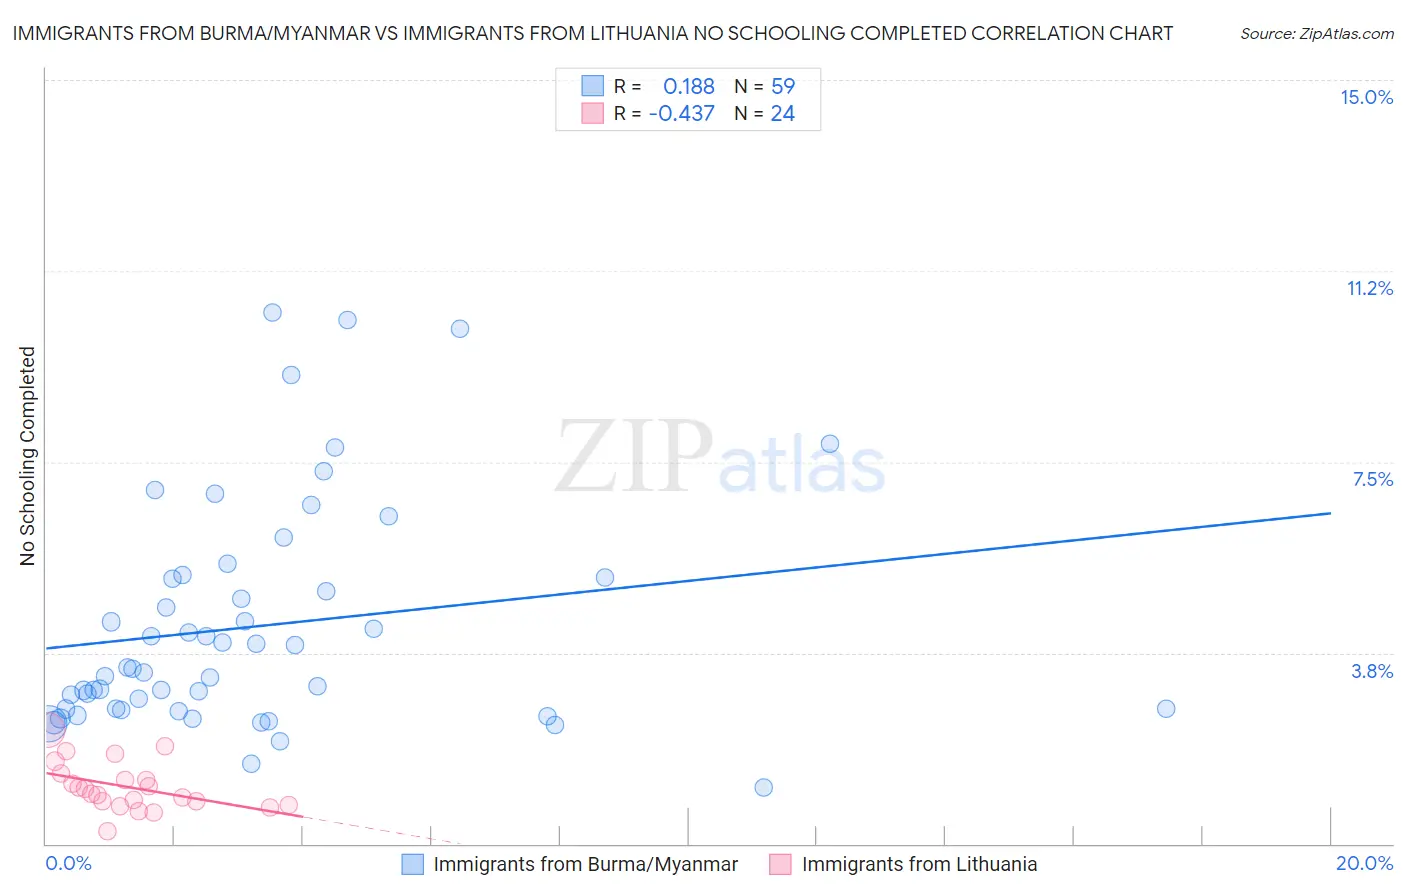
Immigrants from Burma/Myanmar vs Immigrants from Lithuania No Schooling Completed Correlation Chart
The statistical analysis conducted on geographies consisting of 171,802,703 people shows a poor positive correlation between the proportion of Immigrants from Burma/Myanmar and percentage of population with no schooling in the United States with a correlation coefficient (R) of 0.188 and weighted average of 3.1%. Similarly, the statistical analysis conducted on geographies consisting of 117,352,056 people shows a moderate negative correlation between the proportion of Immigrants from Lithuania and percentage of population with no schooling in the United States with a correlation coefficient (R) of -0.437 and weighted average of 1.7%, a difference of 86.1%.
No Schooling Completed Correlation Summary
| Measurement | Immigrants from Burma/Myanmar | Immigrants from Lithuania |
| Minimum | 1.1% | 0.25% |
| Maximum | 10.4% | 2.2% |
| Range | 9.3% | 2.0% |
| Mean | 4.3% | 1.1% |
| Median | 3.4% | 1.0% |
| Interquartile 25% (IQ1) | 2.6% | 0.80% |
| Interquartile 75% (IQ3) | 5.2% | 1.3% |
| Interquartile Range (IQR) | 2.6% | 0.52% |
| Standard Deviation (Sample) | 2.2% | 0.47% |
| Standard Deviation (Population) | 2.2% | 0.46% |
Similar Demographics by No Schooling Completed
Demographics Similar to Immigrants from Burma/Myanmar by No Schooling Completed
In terms of no schooling completed, the demographic groups most similar to Immigrants from Burma/Myanmar are Immigrants from Bangladesh (3.1%, a difference of 0.040%), Immigrants from Laos (3.1%, a difference of 0.15%), Immigrants from Guyana (3.1%, a difference of 0.74%), Immigrants from Honduras (3.2%, a difference of 0.83%), and Vietnamese (3.2%, a difference of 1.0%).
| Demographics | Rating | Rank | No Schooling Completed |
| Sri Lankans | 0.0 /100 | #312 | Tragic 3.0% |
| Hondurans | 0.0 /100 | #313 | Tragic 3.1% |
| Immigrants | Belize | 0.0 /100 | #314 | Tragic 3.1% |
| Immigrants | Nicaragua | 0.0 /100 | #315 | Tragic 3.1% |
| Immigrants | Ecuador | 0.0 /100 | #316 | Tragic 3.1% |
| Cape Verdeans | 0.0 /100 | #317 | Tragic 3.1% |
| Immigrants | Guyana | 0.0 /100 | #318 | Tragic 3.1% |
| Immigrants | Burma/Myanmar | 0.0 /100 | #319 | Tragic 3.1% |
| Immigrants | Bangladesh | 0.0 /100 | #320 | Tragic 3.1% |
| Immigrants | Laos | 0.0 /100 | #321 | Tragic 3.1% |
| Immigrants | Honduras | 0.0 /100 | #322 | Tragic 3.2% |
| Vietnamese | 0.0 /100 | #323 | Tragic 3.2% |
| Mexican American Indians | 0.0 /100 | #324 | Tragic 3.2% |
| Dominicans | 0.0 /100 | #325 | Tragic 3.2% |
| Indonesians | 0.0 /100 | #326 | Tragic 3.2% |
Demographics Similar to Immigrants from Lithuania by No Schooling Completed
In terms of no schooling completed, the demographic groups most similar to Immigrants from Lithuania are Chickasaw (1.7%, a difference of 0.27%), Immigrants from Austria (1.7%, a difference of 0.75%), Canadian (1.7%, a difference of 0.94%), Serbian (1.7%, a difference of 1.1%), and New Zealander (1.7%, a difference of 1.1%).
| Demographics | Rating | Rank | No Schooling Completed |
| Tsimshian | 99.8 /100 | #61 | Exceptional 1.7% |
| Immigrants | Northern Europe | 99.8 /100 | #62 | Exceptional 1.7% |
| Russians | 99.8 /100 | #63 | Exceptional 1.7% |
| New Zealanders | 99.7 /100 | #64 | Exceptional 1.7% |
| Serbians | 99.7 /100 | #65 | Exceptional 1.7% |
| Canadians | 99.7 /100 | #66 | Exceptional 1.7% |
| Immigrants | Austria | 99.7 /100 | #67 | Exceptional 1.7% |
| Immigrants | Lithuania | 99.7 /100 | #68 | Exceptional 1.7% |
| Chickasaw | 99.6 /100 | #69 | Exceptional 1.7% |
| Immigrants | Netherlands | 99.6 /100 | #70 | Exceptional 1.7% |
| Immigrants | England | 99.5 /100 | #71 | Exceptional 1.7% |
| Cajuns | 99.5 /100 | #72 | Exceptional 1.7% |
| Immigrants | India | 99.4 /100 | #73 | Exceptional 1.7% |
| Zimbabweans | 99.4 /100 | #74 | Exceptional 1.7% |
| Immigrants | Belgium | 99.3 /100 | #75 | Exceptional 1.7% |