Nonimmigrants vs Immigrants from India Bachelor's Degree
COMPARE
Nonimmigrants
Immigrants from India
Bachelor's Degree
Bachelor's Degree Comparison
Nonimmigrants
Immigrants from India
34.2%
BACHELOR'S DEGREE
1.8/ 100
METRIC RATING
242nd/ 347
METRIC RANK
51.3%
BACHELOR'S DEGREE
100.0/ 100
METRIC RATING
3rd/ 347
METRIC RANK
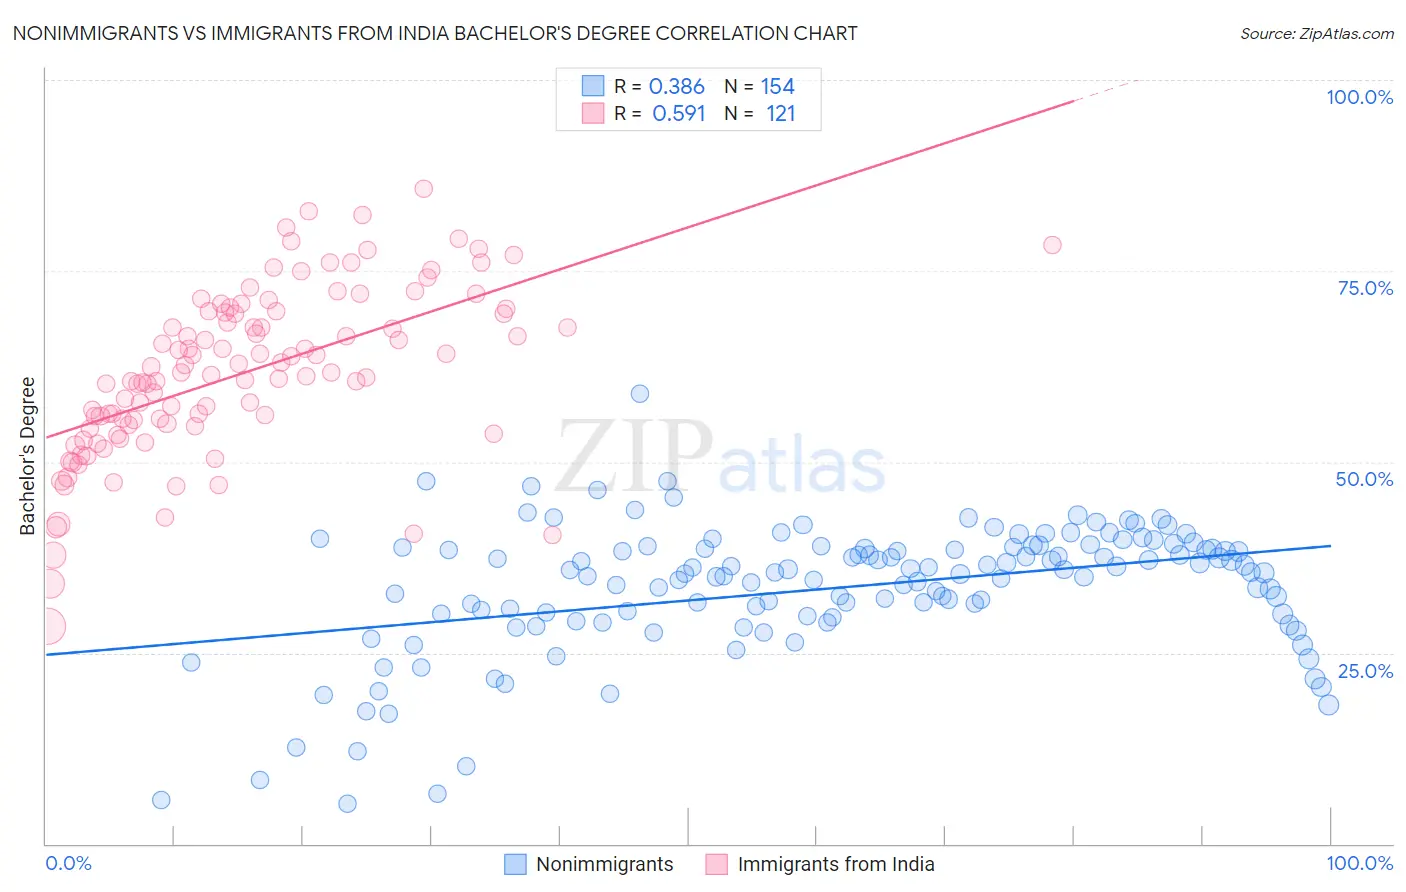
Nonimmigrants vs Immigrants from India Bachelor's Degree Correlation Chart
The statistical analysis conducted on geographies consisting of 584,797,512 people shows a mild positive correlation between the proportion of Nonimmigrants and percentage of population with at least bachelor's degree education in the United States with a correlation coefficient (R) of 0.386 and weighted average of 34.2%. Similarly, the statistical analysis conducted on geographies consisting of 434,046,114 people shows a substantial positive correlation between the proportion of Immigrants from India and percentage of population with at least bachelor's degree education in the United States with a correlation coefficient (R) of 0.591 and weighted average of 51.3%, a difference of 50.2%.
Bachelor's Degree Correlation Summary
| Measurement | Nonimmigrants | Immigrants from India |
| Minimum | 5.2% | 28.5% |
| Maximum | 58.9% | 85.7% |
| Range | 53.7% | 57.2% |
| Mean | 33.4% | 61.6% |
| Median | 35.5% | 61.8% |
| Interquartile 25% (IQ1) | 29.8% | 54.8% |
| Interquartile 75% (IQ3) | 38.6% | 69.7% |
| Interquartile Range (IQR) | 8.9% | 14.9% |
| Standard Deviation (Sample) | 8.6% | 10.9% |
| Standard Deviation (Population) | 8.6% | 10.9% |
Similar Demographics by Bachelor's Degree
Demographics Similar to Nonimmigrants by Bachelor's Degree
In terms of bachelor's degree, the demographic groups most similar to Nonimmigrants are Immigrants from Cambodia (34.2%, a difference of 0.060%), Tongan (34.3%, a difference of 0.33%), Immigrants from Guyana (33.9%, a difference of 0.64%), British West Indian (34.5%, a difference of 0.87%), and Guyanese (34.5%, a difference of 0.89%).
| Demographics | Rating | Rank | Bachelor's Degree |
| Immigrants | West Indies | 2.9 /100 | #235 | Tragic 34.6% |
| Liberians | 2.8 /100 | #236 | Tragic 34.6% |
| Tlingit-Haida | 2.8 /100 | #237 | Tragic 34.6% |
| Guyanese | 2.5 /100 | #238 | Tragic 34.5% |
| British West Indians | 2.5 /100 | #239 | Tragic 34.5% |
| Tongans | 2.0 /100 | #240 | Tragic 34.3% |
| Immigrants | Cambodia | 1.9 /100 | #241 | Tragic 34.2% |
| Immigrants | Nonimmigrants | 1.8 /100 | #242 | Tragic 34.2% |
| Immigrants | Guyana | 1.4 /100 | #243 | Tragic 33.9% |
| Delaware | 1.2 /100 | #244 | Tragic 33.8% |
| Immigrants | Fiji | 1.2 /100 | #245 | Tragic 33.7% |
| Jamaicans | 1.0 /100 | #246 | Tragic 33.6% |
| Immigrants | Congo | 1.0 /100 | #247 | Tragic 33.6% |
| Cree | 1.0 /100 | #248 | Tragic 33.6% |
| Immigrants | Liberia | 0.9 /100 | #249 | Tragic 33.5% |
Demographics Similar to Immigrants from India by Bachelor's Degree
In terms of bachelor's degree, the demographic groups most similar to Immigrants from India are Immigrants from Taiwan (51.2%, a difference of 0.21%), Iranian (51.0%, a difference of 0.63%), Immigrants from Singapore (51.9%, a difference of 1.2%), Okinawan (50.5%, a difference of 1.5%), and Immigrants from Iran (50.3%, a difference of 2.0%).
| Demographics | Rating | Rank | Bachelor's Degree |
| Filipinos | 100.0 /100 | #1 | Exceptional 52.7% |
| Immigrants | Singapore | 100.0 /100 | #2 | Exceptional 51.9% |
| Immigrants | India | 100.0 /100 | #3 | Exceptional 51.3% |
| Immigrants | Taiwan | 100.0 /100 | #4 | Exceptional 51.2% |
| Iranians | 100.0 /100 | #5 | Exceptional 51.0% |
| Okinawans | 100.0 /100 | #6 | Exceptional 50.5% |
| Immigrants | Iran | 100.0 /100 | #7 | Exceptional 50.3% |
| Thais | 100.0 /100 | #8 | Exceptional 50.1% |
| Immigrants | Israel | 100.0 /100 | #9 | Exceptional 50.0% |
| Cypriots | 100.0 /100 | #10 | Exceptional 49.0% |
| Immigrants | Australia | 100.0 /100 | #11 | Exceptional 48.5% |
| Immigrants | China | 100.0 /100 | #12 | Exceptional 48.4% |
| Immigrants | South Central Asia | 100.0 /100 | #13 | Exceptional 48.3% |
| Immigrants | Hong Kong | 100.0 /100 | #14 | Exceptional 48.2% |
| Immigrants | Eastern Asia | 100.0 /100 | #15 | Exceptional 48.1% |