Nonimmigrants vs Belizean Bachelor's Degree
COMPARE
Nonimmigrants
Belizean
Bachelor's Degree
Bachelor's Degree Comparison
Nonimmigrants
Belizeans
34.2%
BACHELOR'S DEGREE
1.8/ 100
METRIC RATING
242nd/ 347
METRIC RANK
32.8%
BACHELOR'S DEGREE
0.4/ 100
METRIC RATING
263rd/ 347
METRIC RANK
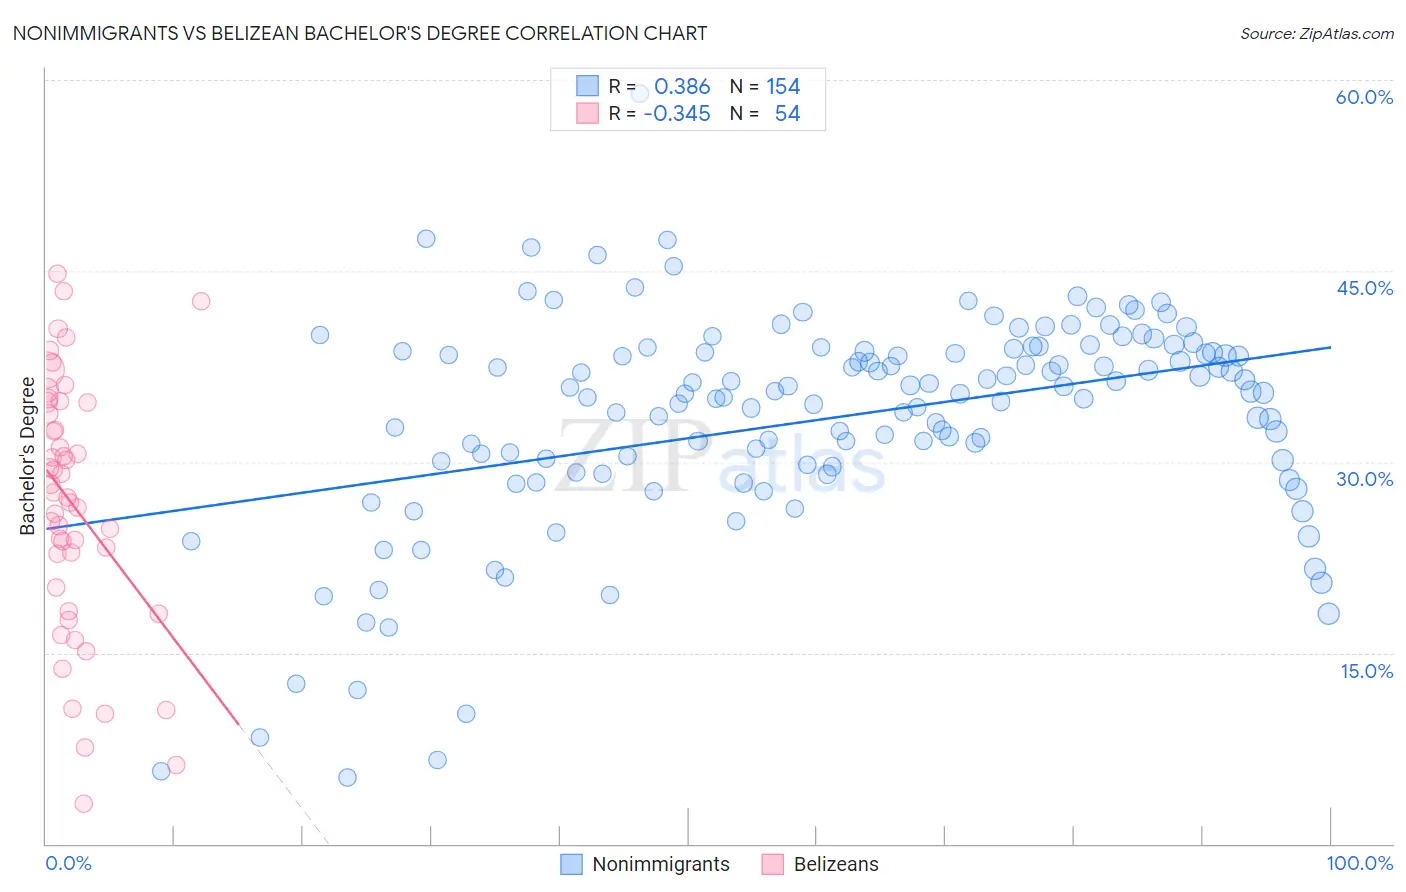
Nonimmigrants vs Belizean Bachelor's Degree Correlation Chart
The statistical analysis conducted on geographies consisting of 584,797,512 people shows a mild positive correlation between the proportion of Nonimmigrants and percentage of population with at least bachelor's degree education in the United States with a correlation coefficient (R) of 0.386 and weighted average of 34.2%. Similarly, the statistical analysis conducted on geographies consisting of 144,217,476 people shows a mild negative correlation between the proportion of Belizeans and percentage of population with at least bachelor's degree education in the United States with a correlation coefficient (R) of -0.345 and weighted average of 32.8%, a difference of 4.2%.
Bachelor's Degree Correlation Summary
| Measurement | Nonimmigrants | Belizean |
| Minimum | 5.2% | 3.1% |
| Maximum | 58.9% | 44.8% |
| Range | 53.7% | 41.6% |
| Mean | 33.4% | 26.6% |
| Median | 35.5% | 27.4% |
| Interquartile 25% (IQ1) | 29.8% | 20.1% |
| Interquartile 75% (IQ3) | 38.6% | 34.7% |
| Interquartile Range (IQR) | 8.9% | 14.6% |
| Standard Deviation (Sample) | 8.6% | 10.0% |
| Standard Deviation (Population) | 8.6% | 9.9% |
Similar Demographics by Bachelor's Degree
Demographics Similar to Nonimmigrants by Bachelor's Degree
In terms of bachelor's degree, the demographic groups most similar to Nonimmigrants are Immigrants from Cambodia (34.2%, a difference of 0.060%), Tongan (34.3%, a difference of 0.33%), Immigrants from Guyana (33.9%, a difference of 0.64%), British West Indian (34.5%, a difference of 0.87%), and Guyanese (34.5%, a difference of 0.89%).
| Demographics | Rating | Rank | Bachelor's Degree |
| Immigrants | West Indies | 2.9 /100 | #235 | Tragic 34.6% |
| Liberians | 2.8 /100 | #236 | Tragic 34.6% |
| Tlingit-Haida | 2.8 /100 | #237 | Tragic 34.6% |
| Guyanese | 2.5 /100 | #238 | Tragic 34.5% |
| British West Indians | 2.5 /100 | #239 | Tragic 34.5% |
| Tongans | 2.0 /100 | #240 | Tragic 34.3% |
| Immigrants | Cambodia | 1.9 /100 | #241 | Tragic 34.2% |
| Immigrants | Nonimmigrants | 1.8 /100 | #242 | Tragic 34.2% |
| Immigrants | Guyana | 1.4 /100 | #243 | Tragic 33.9% |
| Delaware | 1.2 /100 | #244 | Tragic 33.8% |
| Immigrants | Fiji | 1.2 /100 | #245 | Tragic 33.7% |
| Jamaicans | 1.0 /100 | #246 | Tragic 33.6% |
| Immigrants | Congo | 1.0 /100 | #247 | Tragic 33.6% |
| Cree | 1.0 /100 | #248 | Tragic 33.6% |
| Immigrants | Liberia | 0.9 /100 | #249 | Tragic 33.5% |
Demographics Similar to Belizeans by Bachelor's Degree
In terms of bachelor's degree, the demographic groups most similar to Belizeans are African (32.9%, a difference of 0.29%), Immigrants from Jamaica (32.9%, a difference of 0.29%), Malaysian (32.9%, a difference of 0.38%), Osage (33.0%, a difference of 0.75%), and Central American Indian (32.5%, a difference of 0.78%).
| Demographics | Rating | Rank | Bachelor's Degree |
| Nicaraguans | 0.6 /100 | #256 | Tragic 33.1% |
| Spanish Americans | 0.6 /100 | #257 | Tragic 33.1% |
| French American Indians | 0.6 /100 | #258 | Tragic 33.1% |
| Osage | 0.5 /100 | #259 | Tragic 33.0% |
| Malaysians | 0.5 /100 | #260 | Tragic 32.9% |
| Africans | 0.5 /100 | #261 | Tragic 32.9% |
| Immigrants | Jamaica | 0.5 /100 | #262 | Tragic 32.9% |
| Belizeans | 0.4 /100 | #263 | Tragic 32.8% |
| Central American Indians | 0.3 /100 | #264 | Tragic 32.5% |
| Bahamians | 0.3 /100 | #265 | Tragic 32.5% |
| Immigrants | Dominica | 0.3 /100 | #266 | Tragic 32.5% |
| Cubans | 0.3 /100 | #267 | Tragic 32.5% |
| Immigrants | Portugal | 0.2 /100 | #268 | Tragic 32.2% |
| Immigrants | Belize | 0.2 /100 | #269 | Tragic 32.1% |
| Immigrants | Nicaragua | 0.2 /100 | #270 | Tragic 31.9% |