Nonimmigrants vs Immigrants from Korea Bachelor's Degree
COMPARE
Nonimmigrants
Immigrants from Korea
Bachelor's Degree
Bachelor's Degree Comparison
Nonimmigrants
Immigrants from Korea
34.2%
BACHELOR'S DEGREE
1.8/ 100
METRIC RATING
242nd/ 347
METRIC RANK
47.0%
BACHELOR'S DEGREE
100.0/ 100
METRIC RATING
24th/ 347
METRIC RANK
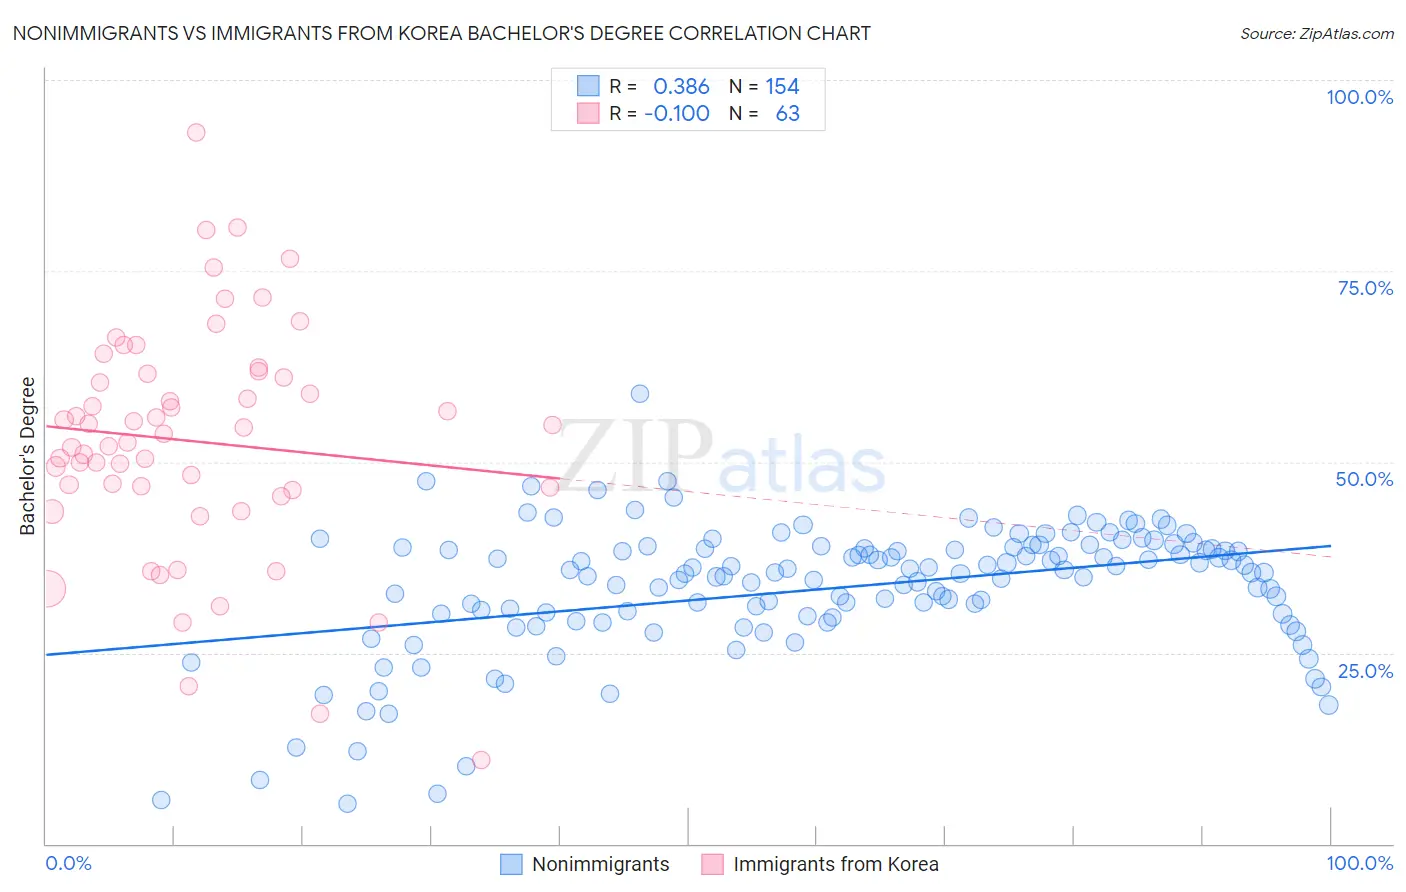
Nonimmigrants vs Immigrants from Korea Bachelor's Degree Correlation Chart
The statistical analysis conducted on geographies consisting of 584,797,512 people shows a mild positive correlation between the proportion of Nonimmigrants and percentage of population with at least bachelor's degree education in the United States with a correlation coefficient (R) of 0.386 and weighted average of 34.2%. Similarly, the statistical analysis conducted on geographies consisting of 416,289,272 people shows a slight negative correlation between the proportion of Immigrants from Korea and percentage of population with at least bachelor's degree education in the United States with a correlation coefficient (R) of -0.100 and weighted average of 47.0%, a difference of 37.5%.
Bachelor's Degree Correlation Summary
| Measurement | Nonimmigrants | Immigrants from Korea |
| Minimum | 5.2% | 10.9% |
| Maximum | 58.9% | 93.1% |
| Range | 53.7% | 82.2% |
| Mean | 33.4% | 52.7% |
| Median | 35.5% | 53.7% |
| Interquartile 25% (IQ1) | 29.8% | 46.3% |
| Interquartile 75% (IQ3) | 38.6% | 61.5% |
| Interquartile Range (IQR) | 8.9% | 15.2% |
| Standard Deviation (Sample) | 8.6% | 15.3% |
| Standard Deviation (Population) | 8.6% | 15.1% |
Similar Demographics by Bachelor's Degree
Demographics Similar to Nonimmigrants by Bachelor's Degree
In terms of bachelor's degree, the demographic groups most similar to Nonimmigrants are Immigrants from Cambodia (34.2%, a difference of 0.060%), Tongan (34.3%, a difference of 0.33%), Immigrants from Guyana (33.9%, a difference of 0.64%), British West Indian (34.5%, a difference of 0.87%), and Guyanese (34.5%, a difference of 0.89%).
| Demographics | Rating | Rank | Bachelor's Degree |
| Immigrants | West Indies | 2.9 /100 | #235 | Tragic 34.6% |
| Liberians | 2.8 /100 | #236 | Tragic 34.6% |
| Tlingit-Haida | 2.8 /100 | #237 | Tragic 34.6% |
| Guyanese | 2.5 /100 | #238 | Tragic 34.5% |
| British West Indians | 2.5 /100 | #239 | Tragic 34.5% |
| Tongans | 2.0 /100 | #240 | Tragic 34.3% |
| Immigrants | Cambodia | 1.9 /100 | #241 | Tragic 34.2% |
| Immigrants | Nonimmigrants | 1.8 /100 | #242 | Tragic 34.2% |
| Immigrants | Guyana | 1.4 /100 | #243 | Tragic 33.9% |
| Delaware | 1.2 /100 | #244 | Tragic 33.8% |
| Immigrants | Fiji | 1.2 /100 | #245 | Tragic 33.7% |
| Jamaicans | 1.0 /100 | #246 | Tragic 33.6% |
| Immigrants | Congo | 1.0 /100 | #247 | Tragic 33.6% |
| Cree | 1.0 /100 | #248 | Tragic 33.6% |
| Immigrants | Liberia | 0.9 /100 | #249 | Tragic 33.5% |
Demographics Similar to Immigrants from Korea by Bachelor's Degree
In terms of bachelor's degree, the demographic groups most similar to Immigrants from Korea are Immigrants from Sweden (47.0%, a difference of 0.040%), Immigrants from Belgium (47.0%, a difference of 0.13%), Burmese (46.9%, a difference of 0.22%), Immigrants from Ireland (47.1%, a difference of 0.33%), and Immigrants from Japan (46.8%, a difference of 0.33%).
| Demographics | Rating | Rank | Bachelor's Degree |
| Eastern Europeans | 100.0 /100 | #17 | Exceptional 47.5% |
| Indians (Asian) | 100.0 /100 | #18 | Exceptional 47.4% |
| Cambodians | 100.0 /100 | #19 | Exceptional 47.2% |
| Immigrants | Switzerland | 100.0 /100 | #20 | Exceptional 47.1% |
| Immigrants | Ireland | 100.0 /100 | #21 | Exceptional 47.1% |
| Immigrants | Belgium | 100.0 /100 | #22 | Exceptional 47.0% |
| Immigrants | Sweden | 100.0 /100 | #23 | Exceptional 47.0% |
| Immigrants | Korea | 100.0 /100 | #24 | Exceptional 47.0% |
| Burmese | 100.0 /100 | #25 | Exceptional 46.9% |
| Immigrants | Japan | 100.0 /100 | #26 | Exceptional 46.8% |
| Immigrants | France | 100.0 /100 | #27 | Exceptional 46.4% |
| Turks | 100.0 /100 | #28 | Exceptional 46.2% |
| Israelis | 100.0 /100 | #29 | Exceptional 46.1% |
| Immigrants | Sri Lanka | 100.0 /100 | #30 | Exceptional 46.1% |
| Latvians | 100.0 /100 | #31 | Exceptional 46.1% |