Ottawa vs Trinidadian and Tobagonian Bachelor's Degree
COMPARE
Ottawa
Trinidadian and Tobagonian
Bachelor's Degree
Bachelor's Degree Comparison
Ottawa
Trinidadians and Tobagonians
31.1%
BACHELOR'S DEGREE
0.1/ 100
METRIC RATING
287th/ 347
METRIC RANK
35.7%
BACHELOR'S DEGREE
8.8/ 100
METRIC RATING
222nd/ 347
METRIC RANK
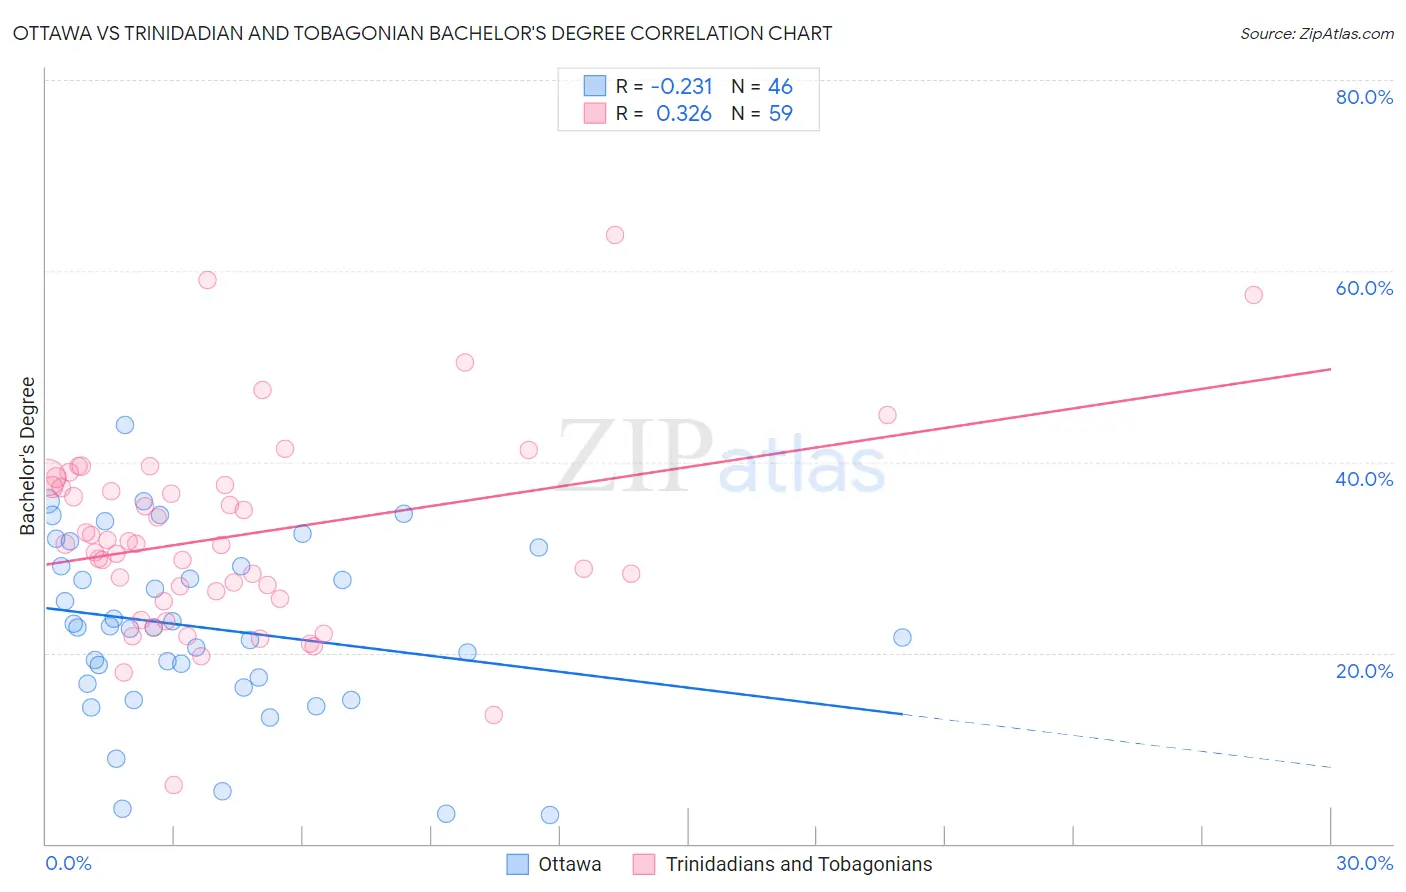
Ottawa vs Trinidadian and Tobagonian Bachelor's Degree Correlation Chart
The statistical analysis conducted on geographies consisting of 49,955,025 people shows a weak negative correlation between the proportion of Ottawa and percentage of population with at least bachelor's degree education in the United States with a correlation coefficient (R) of -0.231 and weighted average of 31.1%. Similarly, the statistical analysis conducted on geographies consisting of 219,852,585 people shows a mild positive correlation between the proportion of Trinidadians and Tobagonians and percentage of population with at least bachelor's degree education in the United States with a correlation coefficient (R) of 0.326 and weighted average of 35.7%, a difference of 14.7%.
Bachelor's Degree Correlation Summary
| Measurement | Ottawa | Trinidadian and Tobagonian |
| Minimum | 3.0% | 6.2% |
| Maximum | 43.8% | 63.7% |
| Range | 40.8% | 57.5% |
| Mean | 22.6% | 32.2% |
| Median | 22.6% | 31.4% |
| Interquartile 25% (IQ1) | 16.7% | 25.6% |
| Interquartile 75% (IQ3) | 29.1% | 37.5% |
| Interquartile Range (IQR) | 12.4% | 11.9% |
| Standard Deviation (Sample) | 9.4% | 10.4% |
| Standard Deviation (Population) | 9.3% | 10.4% |
Similar Demographics by Bachelor's Degree
Demographics Similar to Ottawa by Bachelor's Degree
In terms of bachelor's degree, the demographic groups most similar to Ottawa are Guatemalan (31.0%, a difference of 0.36%), Puerto Rican (31.0%, a difference of 0.50%), Immigrants from Honduras (30.9%, a difference of 0.54%), Black/African American (30.9%, a difference of 0.58%), and Immigrants from El Salvador (31.3%, a difference of 0.62%).
| Demographics | Rating | Rank | Bachelor's Degree |
| Immigrants | Laos | 0.1 /100 | #280 | Tragic 31.6% |
| Blackfeet | 0.1 /100 | #281 | Tragic 31.5% |
| Immigrants | Caribbean | 0.1 /100 | #282 | Tragic 31.4% |
| Hondurans | 0.1 /100 | #283 | Tragic 31.3% |
| Haitians | 0.1 /100 | #284 | Tragic 31.3% |
| Aleuts | 0.1 /100 | #285 | Tragic 31.3% |
| Immigrants | El Salvador | 0.1 /100 | #286 | Tragic 31.3% |
| Ottawa | 0.1 /100 | #287 | Tragic 31.1% |
| Guatemalans | 0.1 /100 | #288 | Tragic 31.0% |
| Puerto Ricans | 0.1 /100 | #289 | Tragic 31.0% |
| Immigrants | Honduras | 0.1 /100 | #290 | Tragic 30.9% |
| Blacks/African Americans | 0.1 /100 | #291 | Tragic 30.9% |
| Ute | 0.1 /100 | #292 | Tragic 30.9% |
| Cape Verdeans | 0.1 /100 | #293 | Tragic 30.9% |
| Immigrants | Guatemala | 0.0 /100 | #294 | Tragic 30.8% |
Demographics Similar to Trinidadians and Tobagonians by Bachelor's Degree
In terms of bachelor's degree, the demographic groups most similar to Trinidadians and Tobagonians are Dutch (35.7%, a difference of 0.14%), French Canadian (35.6%, a difference of 0.18%), Spanish (35.8%, a difference of 0.25%), West Indian (35.8%, a difference of 0.29%), and Subsaharan African (35.8%, a difference of 0.32%).
| Demographics | Rating | Rank | Bachelor's Degree |
| Immigrants | Western Africa | 13.8 /100 | #215 | Poor 36.1% |
| Barbadians | 13.5 /100 | #216 | Poor 36.1% |
| German Russians | 10.2 /100 | #217 | Poor 35.8% |
| Sub-Saharan Africans | 9.8 /100 | #218 | Tragic 35.8% |
| West Indians | 9.7 /100 | #219 | Tragic 35.8% |
| Spanish | 9.6 /100 | #220 | Tragic 35.8% |
| Dutch | 9.2 /100 | #221 | Tragic 35.7% |
| Trinidadians and Tobagonians | 8.8 /100 | #222 | Tragic 35.7% |
| French Canadians | 8.3 /100 | #223 | Tragic 35.6% |
| Immigrants | Barbados | 7.5 /100 | #224 | Tragic 35.5% |
| Immigrants | Burma/Myanmar | 7.3 /100 | #225 | Tragic 35.5% |
| Portuguese | 7.2 /100 | #226 | Tragic 35.5% |
| Ecuadorians | 6.6 /100 | #227 | Tragic 35.4% |
| Immigrants | Trinidad and Tobago | 6.0 /100 | #228 | Tragic 35.3% |
| Whites/Caucasians | 5.9 /100 | #229 | Tragic 35.3% |