Fijian vs Trinidadian and Tobagonian Bachelor's Degree
COMPARE
Fijian
Trinidadian and Tobagonian
Bachelor's Degree
Bachelor's Degree Comparison
Fijians
Trinidadians and Tobagonians
28.7%
BACHELOR'S DEGREE
0.0/ 100
METRIC RATING
323rd/ 347
METRIC RANK
35.7%
BACHELOR'S DEGREE
8.8/ 100
METRIC RATING
222nd/ 347
METRIC RANK
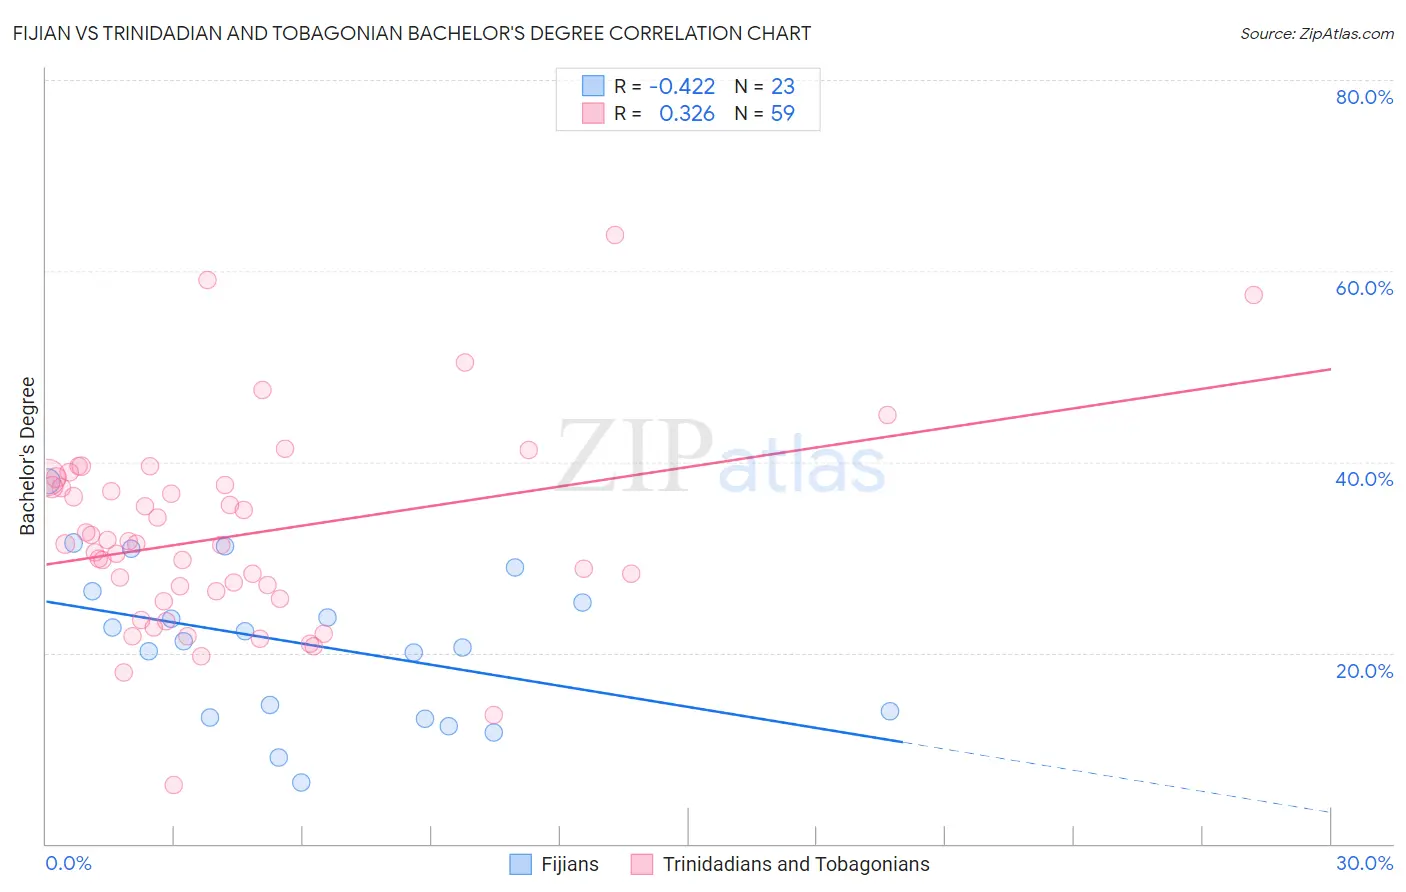
Fijian vs Trinidadian and Tobagonian Bachelor's Degree Correlation Chart
The statistical analysis conducted on geographies consisting of 55,947,282 people shows a moderate negative correlation between the proportion of Fijians and percentage of population with at least bachelor's degree education in the United States with a correlation coefficient (R) of -0.422 and weighted average of 28.7%. Similarly, the statistical analysis conducted on geographies consisting of 219,852,585 people shows a mild positive correlation between the proportion of Trinidadians and Tobagonians and percentage of population with at least bachelor's degree education in the United States with a correlation coefficient (R) of 0.326 and weighted average of 35.7%, a difference of 24.2%.
Bachelor's Degree Correlation Summary
| Measurement | Fijian | Trinidadian and Tobagonian |
| Minimum | 6.4% | 6.2% |
| Maximum | 37.9% | 63.7% |
| Range | 31.5% | 57.5% |
| Mean | 20.9% | 32.2% |
| Median | 21.2% | 31.4% |
| Interquartile 25% (IQ1) | 13.2% | 25.6% |
| Interquartile 75% (IQ3) | 26.5% | 37.5% |
| Interquartile Range (IQR) | 13.2% | 11.9% |
| Standard Deviation (Sample) | 8.2% | 10.4% |
| Standard Deviation (Population) | 8.0% | 10.4% |
Similar Demographics by Bachelor's Degree
Demographics Similar to Fijians by Bachelor's Degree
In terms of bachelor's degree, the demographic groups most similar to Fijians are Tsimshian (28.8%, a difference of 0.14%), Alaskan Athabascan (28.8%, a difference of 0.36%), Kiowa (28.8%, a difference of 0.44%), Creek (28.9%, a difference of 0.48%), and Dutch West Indian (28.5%, a difference of 0.71%).
| Demographics | Rating | Rank | Bachelor's Degree |
| Sioux | 0.0 /100 | #316 | Tragic 29.1% |
| Colville | 0.0 /100 | #317 | Tragic 29.0% |
| Yaqui | 0.0 /100 | #318 | Tragic 29.0% |
| Creek | 0.0 /100 | #319 | Tragic 28.9% |
| Kiowa | 0.0 /100 | #320 | Tragic 28.8% |
| Alaskan Athabascans | 0.0 /100 | #321 | Tragic 28.8% |
| Tsimshian | 0.0 /100 | #322 | Tragic 28.8% |
| Fijians | 0.0 /100 | #323 | Tragic 28.7% |
| Dutch West Indians | 0.0 /100 | #324 | Tragic 28.5% |
| Pennsylvania Germans | 0.0 /100 | #325 | Tragic 28.4% |
| Apache | 0.0 /100 | #326 | Tragic 28.3% |
| Paiute | 0.0 /100 | #327 | Tragic 28.1% |
| Crow | 0.0 /100 | #328 | Tragic 27.7% |
| Immigrants | Central America | 0.0 /100 | #329 | Tragic 27.5% |
| Spanish American Indians | 0.0 /100 | #330 | Tragic 27.5% |
Demographics Similar to Trinidadians and Tobagonians by Bachelor's Degree
In terms of bachelor's degree, the demographic groups most similar to Trinidadians and Tobagonians are Dutch (35.7%, a difference of 0.14%), French Canadian (35.6%, a difference of 0.18%), Spanish (35.8%, a difference of 0.25%), West Indian (35.8%, a difference of 0.29%), and Subsaharan African (35.8%, a difference of 0.32%).
| Demographics | Rating | Rank | Bachelor's Degree |
| Immigrants | Western Africa | 13.8 /100 | #215 | Poor 36.1% |
| Barbadians | 13.5 /100 | #216 | Poor 36.1% |
| German Russians | 10.2 /100 | #217 | Poor 35.8% |
| Sub-Saharan Africans | 9.8 /100 | #218 | Tragic 35.8% |
| West Indians | 9.7 /100 | #219 | Tragic 35.8% |
| Spanish | 9.6 /100 | #220 | Tragic 35.8% |
| Dutch | 9.2 /100 | #221 | Tragic 35.7% |
| Trinidadians and Tobagonians | 8.8 /100 | #222 | Tragic 35.7% |
| French Canadians | 8.3 /100 | #223 | Tragic 35.6% |
| Immigrants | Barbados | 7.5 /100 | #224 | Tragic 35.5% |
| Immigrants | Burma/Myanmar | 7.3 /100 | #225 | Tragic 35.5% |
| Portuguese | 7.2 /100 | #226 | Tragic 35.5% |
| Ecuadorians | 6.6 /100 | #227 | Tragic 35.4% |
| Immigrants | Trinidad and Tobago | 6.0 /100 | #228 | Tragic 35.3% |
| Whites/Caucasians | 5.9 /100 | #229 | Tragic 35.3% |