Czech vs Trinidadian and Tobagonian Bachelor's Degree
COMPARE
Czech
Trinidadian and Tobagonian
Bachelor's Degree
Bachelor's Degree Comparison
Czechs
Trinidadians and Tobagonians
38.0%
BACHELOR'S DEGREE
54.4/ 100
METRIC RATING
170th/ 347
METRIC RANK
35.7%
BACHELOR'S DEGREE
8.8/ 100
METRIC RATING
222nd/ 347
METRIC RANK
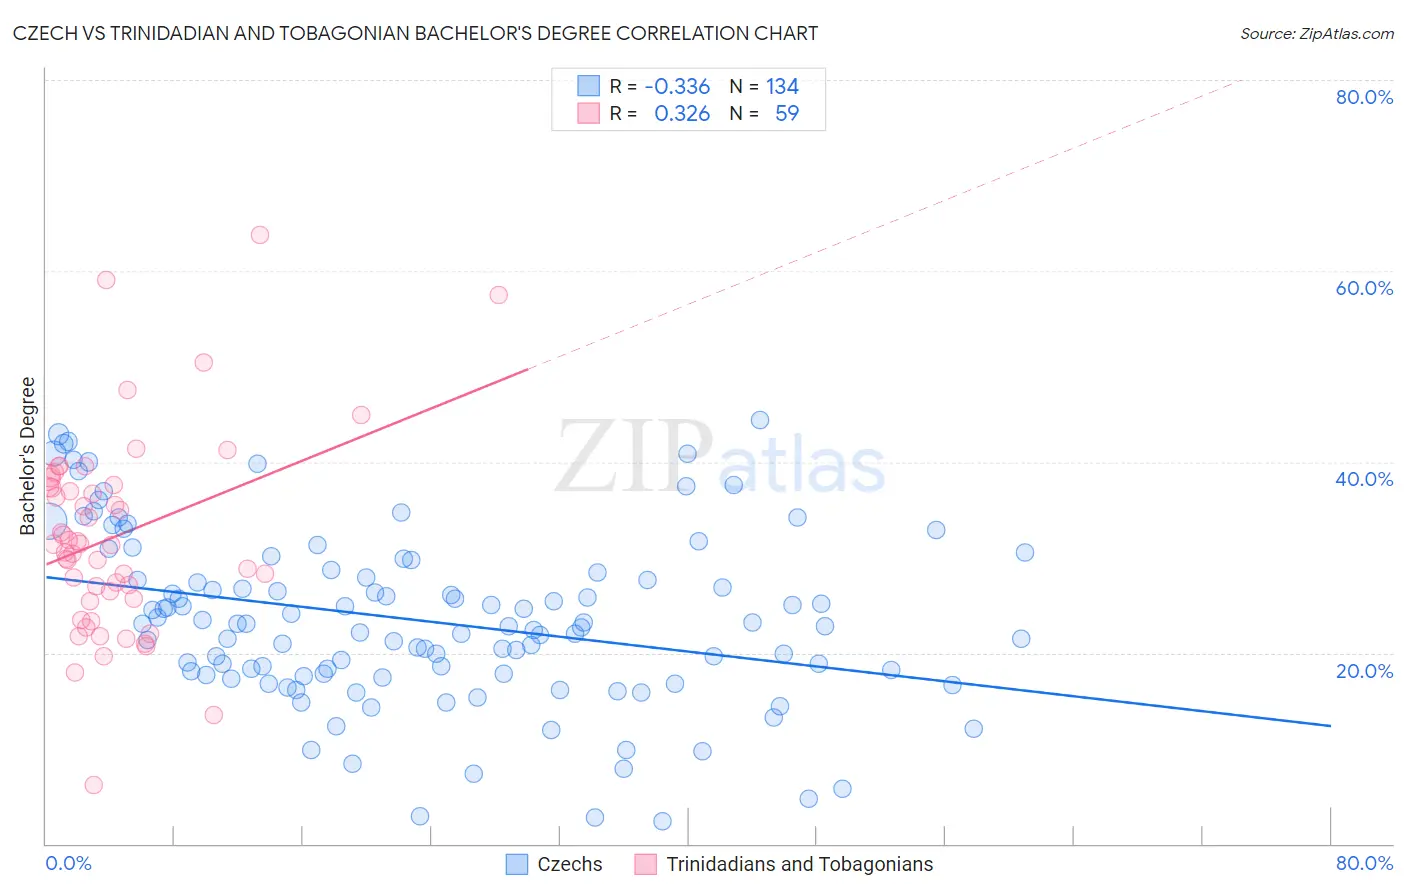
Czech vs Trinidadian and Tobagonian Bachelor's Degree Correlation Chart
The statistical analysis conducted on geographies consisting of 484,759,753 people shows a mild negative correlation between the proportion of Czechs and percentage of population with at least bachelor's degree education in the United States with a correlation coefficient (R) of -0.336 and weighted average of 38.0%. Similarly, the statistical analysis conducted on geographies consisting of 219,852,585 people shows a mild positive correlation between the proportion of Trinidadians and Tobagonians and percentage of population with at least bachelor's degree education in the United States with a correlation coefficient (R) of 0.326 and weighted average of 35.7%, a difference of 6.5%.
Bachelor's Degree Correlation Summary
| Measurement | Czech | Trinidadian and Tobagonian |
| Minimum | 2.4% | 6.2% |
| Maximum | 44.4% | 63.7% |
| Range | 42.1% | 57.5% |
| Mean | 23.4% | 32.2% |
| Median | 22.9% | 31.4% |
| Interquartile 25% (IQ1) | 17.8% | 25.6% |
| Interquartile 75% (IQ3) | 28.5% | 37.5% |
| Interquartile Range (IQR) | 10.6% | 11.9% |
| Standard Deviation (Sample) | 9.0% | 10.4% |
| Standard Deviation (Population) | 9.0% | 10.4% |
Similar Demographics by Bachelor's Degree
Demographics Similar to Czechs by Bachelor's Degree
In terms of bachelor's degree, the demographic groups most similar to Czechs are Bermudan (38.0%, a difference of 0.010%), Ghanaian (38.0%, a difference of 0.10%), Immigrants from Somalia (37.9%, a difference of 0.15%), Danish (38.1%, a difference of 0.18%), and Immigrants from Iraq (37.9%, a difference of 0.18%).
| Demographics | Rating | Rank | Bachelor's Degree |
| Peruvians | 63.4 /100 | #163 | Good 38.3% |
| Hungarians | 62.1 /100 | #164 | Good 38.3% |
| Sri Lankans | 59.1 /100 | #165 | Average 38.2% |
| Somalis | 58.6 /100 | #166 | Average 38.1% |
| Scottish | 56.6 /100 | #167 | Average 38.1% |
| Danes | 56.2 /100 | #168 | Average 38.1% |
| Ghanaians | 55.3 /100 | #169 | Average 38.0% |
| Czechs | 54.4 /100 | #170 | Average 38.0% |
| Bermudans | 54.2 /100 | #171 | Average 38.0% |
| Immigrants | Somalia | 52.8 /100 | #172 | Average 37.9% |
| Immigrants | Iraq | 52.5 /100 | #173 | Average 37.9% |
| Immigrants | Bangladesh | 50.0 /100 | #174 | Average 37.8% |
| Immigrants | Uruguay | 48.3 /100 | #175 | Average 37.8% |
| Costa Ricans | 47.6 /100 | #176 | Average 37.7% |
| Basques | 47.4 /100 | #177 | Average 37.7% |
Demographics Similar to Trinidadians and Tobagonians by Bachelor's Degree
In terms of bachelor's degree, the demographic groups most similar to Trinidadians and Tobagonians are Dutch (35.7%, a difference of 0.14%), French Canadian (35.6%, a difference of 0.18%), Spanish (35.8%, a difference of 0.25%), West Indian (35.8%, a difference of 0.29%), and Subsaharan African (35.8%, a difference of 0.32%).
| Demographics | Rating | Rank | Bachelor's Degree |
| Immigrants | Western Africa | 13.8 /100 | #215 | Poor 36.1% |
| Barbadians | 13.5 /100 | #216 | Poor 36.1% |
| German Russians | 10.2 /100 | #217 | Poor 35.8% |
| Sub-Saharan Africans | 9.8 /100 | #218 | Tragic 35.8% |
| West Indians | 9.7 /100 | #219 | Tragic 35.8% |
| Spanish | 9.6 /100 | #220 | Tragic 35.8% |
| Dutch | 9.2 /100 | #221 | Tragic 35.7% |
| Trinidadians and Tobagonians | 8.8 /100 | #222 | Tragic 35.7% |
| French Canadians | 8.3 /100 | #223 | Tragic 35.6% |
| Immigrants | Barbados | 7.5 /100 | #224 | Tragic 35.5% |
| Immigrants | Burma/Myanmar | 7.3 /100 | #225 | Tragic 35.5% |
| Portuguese | 7.2 /100 | #226 | Tragic 35.5% |
| Ecuadorians | 6.6 /100 | #227 | Tragic 35.4% |
| Immigrants | Trinidad and Tobago | 6.0 /100 | #228 | Tragic 35.3% |
| Whites/Caucasians | 5.9 /100 | #229 | Tragic 35.3% |