Ecuadorian vs Bermudan GED/Equivalency
COMPARE
Ecuadorian
Bermudan
GED/Equivalency
GED/Equivalency Comparison
Ecuadorians
Bermudans
81.7%
GED/EQUIVALENCY
0.0/ 100
METRIC RATING
299th/ 347
METRIC RANK
85.8%
GED/EQUIVALENCY
55.1/ 100
METRIC RATING
172nd/ 347
METRIC RANK
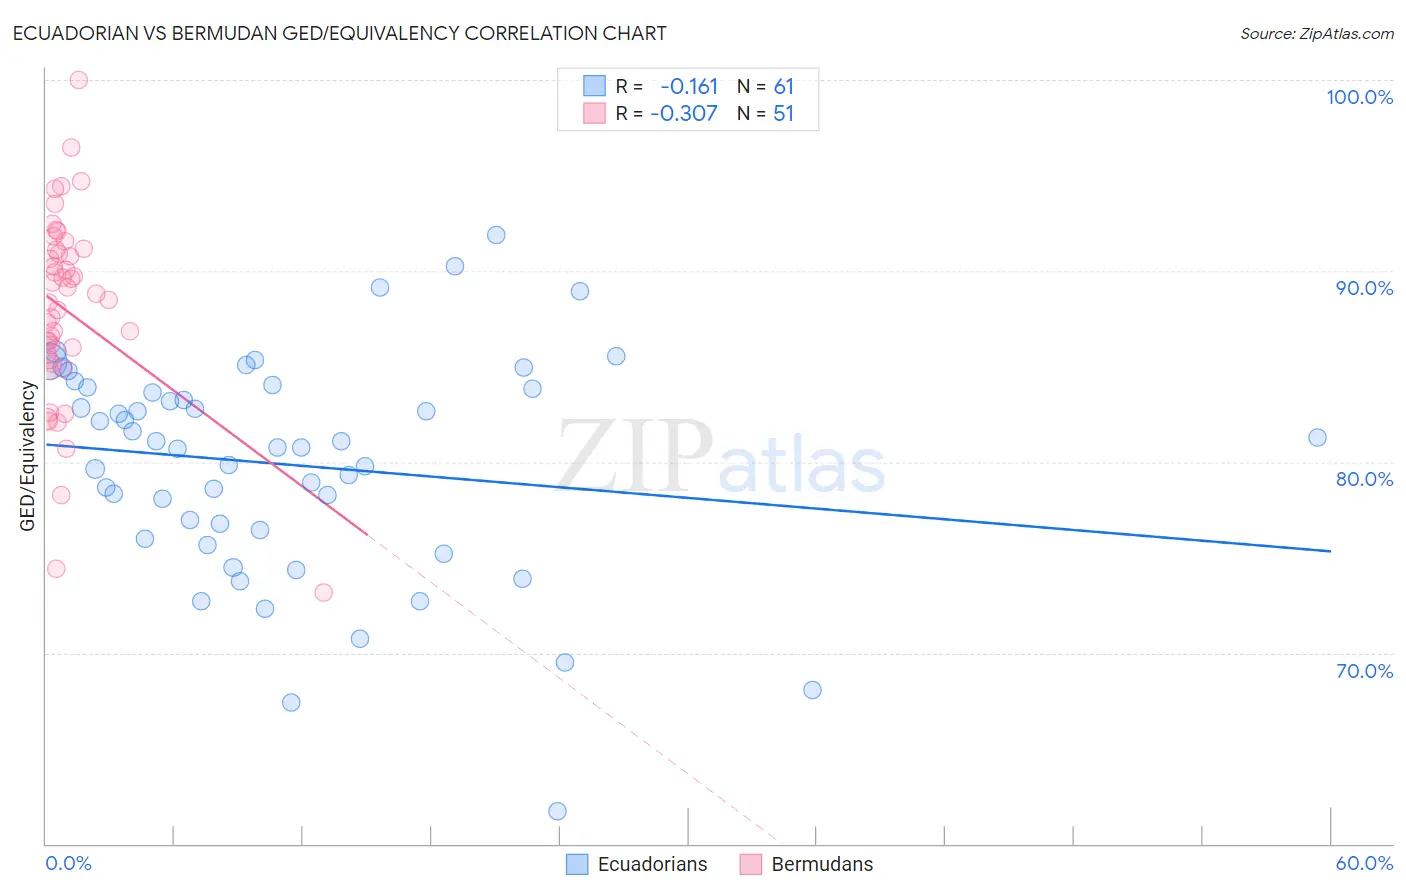
Ecuadorian vs Bermudan GED/Equivalency Correlation Chart
The statistical analysis conducted on geographies consisting of 317,864,750 people shows a poor negative correlation between the proportion of Ecuadorians and percentage of population with at least ged/equivalency education in the United States with a correlation coefficient (R) of -0.161 and weighted average of 81.7%. Similarly, the statistical analysis conducted on geographies consisting of 55,728,561 people shows a mild negative correlation between the proportion of Bermudans and percentage of population with at least ged/equivalency education in the United States with a correlation coefficient (R) of -0.307 and weighted average of 85.8%, a difference of 5.1%.
GED/Equivalency Correlation Summary
| Measurement | Ecuadorian | Bermudan |
| Minimum | 61.7% | 73.2% |
| Maximum | 91.9% | 100.0% |
| Range | 30.2% | 26.8% |
| Mean | 79.8% | 87.9% |
| Median | 80.8% | 88.5% |
| Interquartile 25% (IQ1) | 76.2% | 85.3% |
| Interquartile 75% (IQ3) | 83.9% | 91.1% |
| Interquartile Range (IQR) | 7.7% | 5.8% |
| Standard Deviation (Sample) | 5.8% | 5.1% |
| Standard Deviation (Population) | 5.8% | 5.0% |
Similar Demographics by GED/Equivalency
Demographics Similar to Ecuadorians by GED/Equivalency
In terms of ged/equivalency, the demographic groups most similar to Ecuadorians are Fijian (81.6%, a difference of 0.070%), Dutch West Indian (81.6%, a difference of 0.13%), Ute (81.8%, a difference of 0.14%), Immigrants from Haiti (81.6%, a difference of 0.16%), and Immigrants from Portugal (81.6%, a difference of 0.17%).
| Demographics | Rating | Rank | GED/Equivalency |
| Paiute | 0.0 /100 | #292 | Tragic 82.0% |
| British West Indians | 0.0 /100 | #293 | Tragic 82.0% |
| Immigrants | St. Vincent and the Grenadines | 0.0 /100 | #294 | Tragic 82.0% |
| Nepalese | 0.0 /100 | #295 | Tragic 81.9% |
| Vietnamese | 0.0 /100 | #296 | Tragic 81.9% |
| Immigrants | Bangladesh | 0.0 /100 | #297 | Tragic 81.9% |
| Ute | 0.0 /100 | #298 | Tragic 81.8% |
| Ecuadorians | 0.0 /100 | #299 | Tragic 81.7% |
| Fijians | 0.0 /100 | #300 | Tragic 81.6% |
| Dutch West Indians | 0.0 /100 | #301 | Tragic 81.6% |
| Immigrants | Haiti | 0.0 /100 | #302 | Tragic 81.6% |
| Immigrants | Portugal | 0.0 /100 | #303 | Tragic 81.6% |
| Navajo | 0.0 /100 | #304 | Tragic 81.5% |
| Immigrants | Grenada | 0.0 /100 | #305 | Tragic 81.3% |
| Guyanese | 0.0 /100 | #306 | Tragic 81.3% |
Demographics Similar to Bermudans by GED/Equivalency
In terms of ged/equivalency, the demographic groups most similar to Bermudans are Immigrants from Chile (85.9%, a difference of 0.050%), Immigrants from Venezuela (85.8%, a difference of 0.090%), Afghan (85.9%, a difference of 0.10%), Ottawa (85.8%, a difference of 0.10%), and Immigrants from Bolivia (85.8%, a difference of 0.11%).
| Demographics | Rating | Rank | GED/Equivalency |
| Alsatians | 64.3 /100 | #165 | Good 86.0% |
| Immigrants | Albania | 64.2 /100 | #166 | Good 86.0% |
| Ethiopians | 63.7 /100 | #167 | Good 86.0% |
| Sierra Leoneans | 61.8 /100 | #168 | Good 86.0% |
| Immigrants | Ethiopia | 61.2 /100 | #169 | Good 86.0% |
| Afghans | 59.7 /100 | #170 | Average 85.9% |
| Immigrants | Chile | 57.3 /100 | #171 | Average 85.9% |
| Bermudans | 55.1 /100 | #172 | Average 85.8% |
| Immigrants | Venezuela | 50.7 /100 | #173 | Average 85.8% |
| Ottawa | 50.0 /100 | #174 | Average 85.8% |
| Immigrants | Bolivia | 49.8 /100 | #175 | Average 85.8% |
| Immigrants | Eastern Africa | 47.7 /100 | #176 | Average 85.7% |
| Immigrants | Uganda | 45.2 /100 | #177 | Average 85.7% |
| Koreans | 41.2 /100 | #178 | Average 85.6% |
| Aleuts | 40.5 /100 | #179 | Average 85.6% |