Nepalese vs Immigrants from Nigeria College, Under 1 year
COMPARE
Nepalese
Immigrants from Nigeria
College, Under 1 year
College, Under 1 year Comparison
Nepalese
Immigrants from Nigeria
62.2%
COLLEGE, UNDER 1 YEAR
1.1/ 100
METRIC RATING
239th/ 347
METRIC RANK
63.7%
COLLEGE, UNDER 1 YEAR
8.8/ 100
METRIC RATING
214th/ 347
METRIC RANK
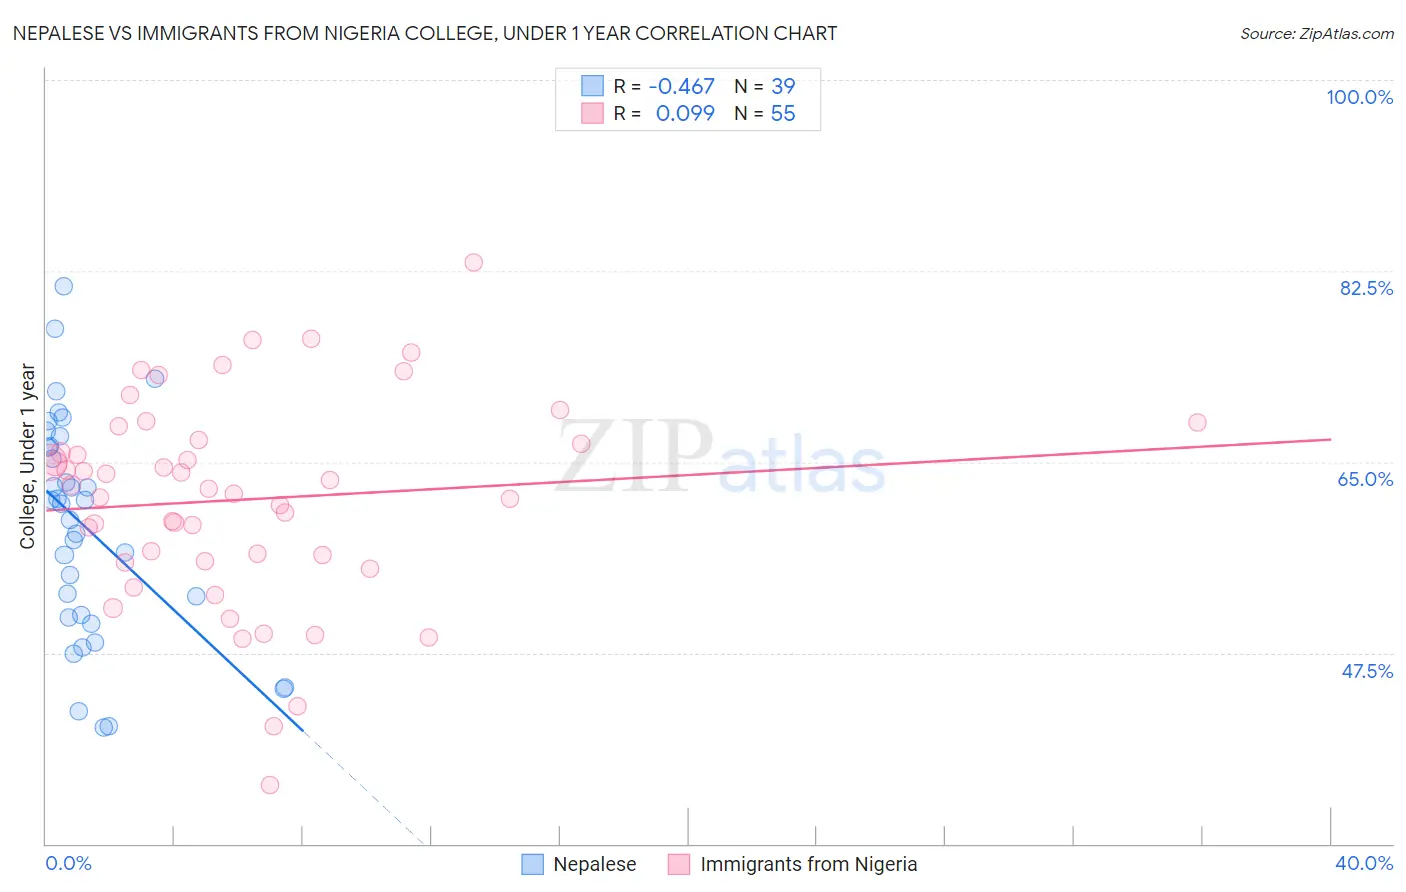
Nepalese vs Immigrants from Nigeria College, Under 1 year Correlation Chart
The statistical analysis conducted on geographies consisting of 24,519,269 people shows a moderate negative correlation between the proportion of Nepalese and percentage of population with at least college, under 1 year education in the United States with a correlation coefficient (R) of -0.467 and weighted average of 62.2%. Similarly, the statistical analysis conducted on geographies consisting of 283,490,343 people shows a slight positive correlation between the proportion of Immigrants from Nigeria and percentage of population with at least college, under 1 year education in the United States with a correlation coefficient (R) of 0.099 and weighted average of 63.7%, a difference of 2.5%.
College, Under 1 year Correlation Summary
| Measurement | Nepalese | Immigrants from Nigeria |
| Minimum | 40.7% | 35.4% |
| Maximum | 81.1% | 83.3% |
| Range | 40.5% | 47.9% |
| Mean | 58.9% | 61.5% |
| Median | 61.2% | 62.6% |
| Interquartile 25% (IQ1) | 50.7% | 55.9% |
| Interquartile 75% (IQ3) | 66.4% | 67.0% |
| Interquartile Range (IQR) | 15.7% | 11.0% |
| Standard Deviation (Sample) | 10.2% | 9.4% |
| Standard Deviation (Population) | 10.0% | 9.3% |
Similar Demographics by College, Under 1 year
Demographics Similar to Nepalese by College, Under 1 year
In terms of college, under 1 year, the demographic groups most similar to Nepalese are Aleut (62.2%, a difference of 0.0%), Ottawa (62.2%, a difference of 0.010%), Malaysian (62.2%, a difference of 0.060%), Hawaiian (62.1%, a difference of 0.090%), and Colville (62.1%, a difference of 0.18%).
| Demographics | Rating | Rank | College, Under 1 year |
| Osage | 2.2 /100 | #232 | Tragic 62.7% |
| Iroquois | 2.0 /100 | #233 | Tragic 62.6% |
| Chippewa | 2.0 /100 | #234 | Tragic 62.6% |
| Spanish Americans | 1.9 /100 | #235 | Tragic 62.6% |
| Immigrants | Immigrants | 1.7 /100 | #236 | Tragic 62.5% |
| Immigrants | Burma/Myanmar | 1.6 /100 | #237 | Tragic 62.5% |
| French American Indians | 1.5 /100 | #238 | Tragic 62.4% |
| Nepalese | 1.1 /100 | #239 | Tragic 62.2% |
| Aleuts | 1.1 /100 | #240 | Tragic 62.2% |
| Ottawa | 1.1 /100 | #241 | Tragic 62.2% |
| Malaysians | 1.1 /100 | #242 | Tragic 62.2% |
| Hawaiians | 1.1 /100 | #243 | Tragic 62.1% |
| Colville | 1.0 /100 | #244 | Tragic 62.1% |
| Delaware | 0.9 /100 | #245 | Tragic 62.1% |
| Marshallese | 0.8 /100 | #246 | Tragic 61.9% |
Demographics Similar to Immigrants from Nigeria by College, Under 1 year
In terms of college, under 1 year, the demographic groups most similar to Immigrants from Nigeria are Immigrants from South America (63.8%, a difference of 0.040%), Senegalese (63.6%, a difference of 0.17%), Immigrants from Middle Africa (63.9%, a difference of 0.22%), Native Hawaiian (63.9%, a difference of 0.23%), and Ghanaian (63.9%, a difference of 0.30%).
| Demographics | Rating | Rank | College, Under 1 year |
| Colombians | 12.4 /100 | #207 | Poor 64.0% |
| Immigrants | Vietnam | 12.1 /100 | #208 | Poor 64.0% |
| Puget Sound Salish | 11.3 /100 | #209 | Poor 63.9% |
| Ghanaians | 11.2 /100 | #210 | Poor 63.9% |
| Native Hawaiians | 10.6 /100 | #211 | Poor 63.9% |
| Immigrants | Middle Africa | 10.5 /100 | #212 | Poor 63.9% |
| Immigrants | South America | 9.1 /100 | #213 | Tragic 63.8% |
| Immigrants | Nigeria | 8.8 /100 | #214 | Tragic 63.7% |
| Senegalese | 7.7 /100 | #215 | Tragic 63.6% |
| Hmong | 6.8 /100 | #216 | Tragic 63.5% |
| Immigrants | Uruguay | 5.8 /100 | #217 | Tragic 63.4% |
| Immigrants | Panama | 5.7 /100 | #218 | Tragic 63.4% |
| Immigrants | Fiji | 5.7 /100 | #219 | Tragic 63.4% |
| Portuguese | 5.6 /100 | #220 | Tragic 63.4% |
| Cree | 5.2 /100 | #221 | Tragic 63.3% |