Nepalese vs Icelander College, Under 1 year
COMPARE
Nepalese
Icelander
College, Under 1 year
College, Under 1 year Comparison
Nepalese
Icelanders
62.2%
COLLEGE, UNDER 1 YEAR
1.1/ 100
METRIC RATING
239th/ 347
METRIC RANK
68.3%
COLLEGE, UNDER 1 YEAR
98.1/ 100
METRIC RATING
90th/ 347
METRIC RANK
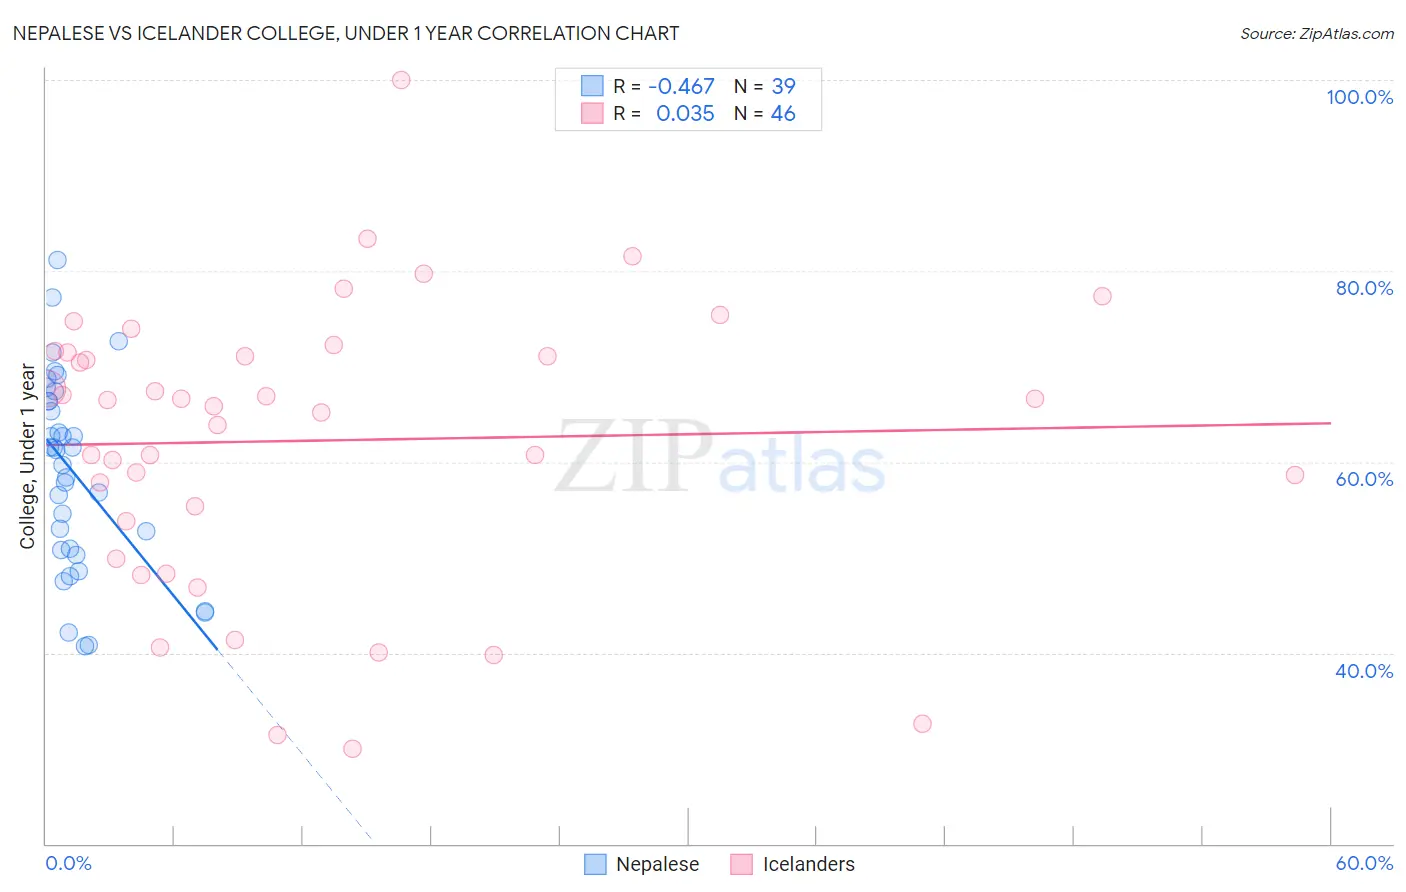
Nepalese vs Icelander College, Under 1 year Correlation Chart
The statistical analysis conducted on geographies consisting of 24,519,269 people shows a moderate negative correlation between the proportion of Nepalese and percentage of population with at least college, under 1 year education in the United States with a correlation coefficient (R) of -0.467 and weighted average of 62.2%. Similarly, the statistical analysis conducted on geographies consisting of 159,668,975 people shows no correlation between the proportion of Icelanders and percentage of population with at least college, under 1 year education in the United States with a correlation coefficient (R) of 0.035 and weighted average of 68.3%, a difference of 9.8%.
College, Under 1 year Correlation Summary
| Measurement | Nepalese | Icelander |
| Minimum | 40.7% | 30.0% |
| Maximum | 81.1% | 100.0% |
| Range | 40.5% | 70.0% |
| Mean | 58.9% | 62.2% |
| Median | 61.2% | 66.2% |
| Interquartile 25% (IQ1) | 50.7% | 53.8% |
| Interquartile 75% (IQ3) | 66.4% | 71.5% |
| Interquartile Range (IQR) | 15.7% | 17.7% |
| Standard Deviation (Sample) | 10.2% | 14.9% |
| Standard Deviation (Population) | 10.0% | 14.7% |
Similar Demographics by College, Under 1 year
Demographics Similar to Nepalese by College, Under 1 year
In terms of college, under 1 year, the demographic groups most similar to Nepalese are Aleut (62.2%, a difference of 0.0%), Ottawa (62.2%, a difference of 0.010%), Malaysian (62.2%, a difference of 0.060%), Hawaiian (62.1%, a difference of 0.090%), and Colville (62.1%, a difference of 0.18%).
| Demographics | Rating | Rank | College, Under 1 year |
| Osage | 2.2 /100 | #232 | Tragic 62.7% |
| Iroquois | 2.0 /100 | #233 | Tragic 62.6% |
| Chippewa | 2.0 /100 | #234 | Tragic 62.6% |
| Spanish Americans | 1.9 /100 | #235 | Tragic 62.6% |
| Immigrants | Immigrants | 1.7 /100 | #236 | Tragic 62.5% |
| Immigrants | Burma/Myanmar | 1.6 /100 | #237 | Tragic 62.5% |
| French American Indians | 1.5 /100 | #238 | Tragic 62.4% |
| Nepalese | 1.1 /100 | #239 | Tragic 62.2% |
| Aleuts | 1.1 /100 | #240 | Tragic 62.2% |
| Ottawa | 1.1 /100 | #241 | Tragic 62.2% |
| Malaysians | 1.1 /100 | #242 | Tragic 62.2% |
| Hawaiians | 1.1 /100 | #243 | Tragic 62.1% |
| Colville | 1.0 /100 | #244 | Tragic 62.1% |
| Delaware | 0.9 /100 | #245 | Tragic 62.1% |
| Marshallese | 0.8 /100 | #246 | Tragic 61.9% |
Demographics Similar to Icelanders by College, Under 1 year
In terms of college, under 1 year, the demographic groups most similar to Icelanders are European (68.2%, a difference of 0.030%), Luxembourger (68.2%, a difference of 0.040%), Ethiopian (68.3%, a difference of 0.060%), Croatian (68.3%, a difference of 0.070%), and Chinese (68.3%, a difference of 0.090%).
| Demographics | Rating | Rank | College, Under 1 year |
| Argentineans | 98.4 /100 | #83 | Exceptional 68.4% |
| Immigrants | Hungary | 98.3 /100 | #84 | Exceptional 68.3% |
| Egyptians | 98.3 /100 | #85 | Exceptional 68.3% |
| Immigrants | Lebanon | 98.3 /100 | #86 | Exceptional 68.3% |
| Chinese | 98.3 /100 | #87 | Exceptional 68.3% |
| Croatians | 98.2 /100 | #88 | Exceptional 68.3% |
| Ethiopians | 98.2 /100 | #89 | Exceptional 68.3% |
| Icelanders | 98.1 /100 | #90 | Exceptional 68.3% |
| Europeans | 98.1 /100 | #91 | Exceptional 68.2% |
| Luxembourgers | 98.1 /100 | #92 | Exceptional 68.2% |
| Romanians | 97.9 /100 | #93 | Exceptional 68.2% |
| Armenians | 97.7 /100 | #94 | Exceptional 68.1% |
| Immigrants | Pakistan | 97.5 /100 | #95 | Exceptional 68.0% |
| Jordanians | 97.4 /100 | #96 | Exceptional 68.0% |
| Immigrants | Ethiopia | 97.3 /100 | #97 | Exceptional 68.0% |