Slavic vs Immigrants from Nigeria College, Under 1 year
COMPARE
Slavic
Immigrants from Nigeria
College, Under 1 year
College, Under 1 year Comparison
Slavs
Immigrants from Nigeria
66.7%
COLLEGE, UNDER 1 YEAR
85.9/ 100
METRIC RATING
140th/ 347
METRIC RANK
63.7%
COLLEGE, UNDER 1 YEAR
8.8/ 100
METRIC RATING
214th/ 347
METRIC RANK
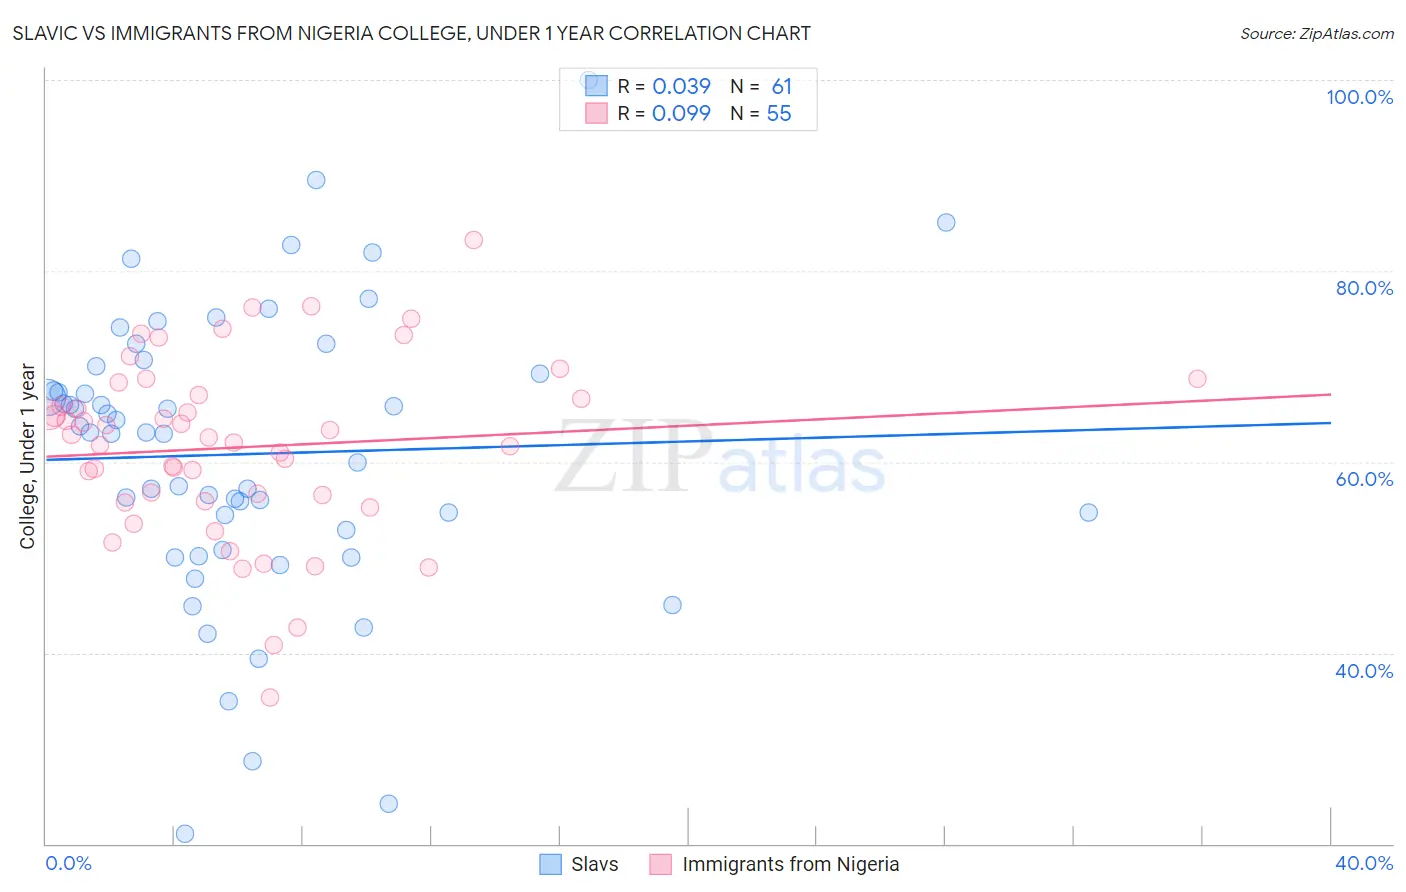
Slavic vs Immigrants from Nigeria College, Under 1 year Correlation Chart
The statistical analysis conducted on geographies consisting of 270,867,455 people shows no correlation between the proportion of Slavs and percentage of population with at least college, under 1 year education in the United States with a correlation coefficient (R) of 0.039 and weighted average of 66.7%. Similarly, the statistical analysis conducted on geographies consisting of 283,490,343 people shows a slight positive correlation between the proportion of Immigrants from Nigeria and percentage of population with at least college, under 1 year education in the United States with a correlation coefficient (R) of 0.099 and weighted average of 63.7%, a difference of 4.7%.
College, Under 1 year Correlation Summary
| Measurement | Slavic | Immigrants from Nigeria |
| Minimum | 21.0% | 35.4% |
| Maximum | 100.0% | 83.3% |
| Range | 79.0% | 47.9% |
| Mean | 60.8% | 61.5% |
| Median | 63.0% | 62.6% |
| Interquartile 25% (IQ1) | 51.8% | 55.9% |
| Interquartile 75% (IQ3) | 69.7% | 67.0% |
| Interquartile Range (IQR) | 17.9% | 11.0% |
| Standard Deviation (Sample) | 15.1% | 9.4% |
| Standard Deviation (Population) | 14.9% | 9.3% |
Similar Demographics by College, Under 1 year
Demographics Similar to Slavs by College, Under 1 year
In terms of college, under 1 year, the demographic groups most similar to Slavs are Venezuelan (66.7%, a difference of 0.0%), Immigrants from Afghanistan (66.7%, a difference of 0.070%), Immigrants from Italy (66.8%, a difference of 0.10%), Immigrants from Chile (66.8%, a difference of 0.15%), and Ugandan (66.8%, a difference of 0.18%).
| Demographics | Rating | Rank | College, Under 1 year |
| Immigrants | Brazil | 88.3 /100 | #133 | Excellent 66.9% |
| Iraqis | 88.0 /100 | #134 | Excellent 66.8% |
| Canadians | 87.9 /100 | #135 | Excellent 66.8% |
| Ugandans | 87.8 /100 | #136 | Excellent 66.8% |
| Immigrants | Chile | 87.4 /100 | #137 | Excellent 66.8% |
| Immigrants | Italy | 86.9 /100 | #138 | Excellent 66.8% |
| Venezuelans | 85.9 /100 | #139 | Excellent 66.7% |
| Slavs | 85.9 /100 | #140 | Excellent 66.7% |
| Immigrants | Afghanistan | 85.1 /100 | #141 | Excellent 66.7% |
| English | 82.9 /100 | #142 | Excellent 66.6% |
| Immigrants | Uganda | 82.8 /100 | #143 | Excellent 66.5% |
| Immigrants | Germany | 82.0 /100 | #144 | Excellent 66.5% |
| Immigrants | Kenya | 81.8 /100 | #145 | Excellent 66.5% |
| Kenyans | 81.7 /100 | #146 | Excellent 66.5% |
| Immigrants | Morocco | 81.7 /100 | #147 | Excellent 66.5% |
Demographics Similar to Immigrants from Nigeria by College, Under 1 year
In terms of college, under 1 year, the demographic groups most similar to Immigrants from Nigeria are Immigrants from South America (63.8%, a difference of 0.040%), Senegalese (63.6%, a difference of 0.17%), Immigrants from Middle Africa (63.9%, a difference of 0.22%), Native Hawaiian (63.9%, a difference of 0.23%), and Ghanaian (63.9%, a difference of 0.30%).
| Demographics | Rating | Rank | College, Under 1 year |
| Colombians | 12.4 /100 | #207 | Poor 64.0% |
| Immigrants | Vietnam | 12.1 /100 | #208 | Poor 64.0% |
| Puget Sound Salish | 11.3 /100 | #209 | Poor 63.9% |
| Ghanaians | 11.2 /100 | #210 | Poor 63.9% |
| Native Hawaiians | 10.6 /100 | #211 | Poor 63.9% |
| Immigrants | Middle Africa | 10.5 /100 | #212 | Poor 63.9% |
| Immigrants | South America | 9.1 /100 | #213 | Tragic 63.8% |
| Immigrants | Nigeria | 8.8 /100 | #214 | Tragic 63.7% |
| Senegalese | 7.7 /100 | #215 | Tragic 63.6% |
| Hmong | 6.8 /100 | #216 | Tragic 63.5% |
| Immigrants | Uruguay | 5.8 /100 | #217 | Tragic 63.4% |
| Immigrants | Panama | 5.7 /100 | #218 | Tragic 63.4% |
| Immigrants | Fiji | 5.7 /100 | #219 | Tragic 63.4% |
| Portuguese | 5.6 /100 | #220 | Tragic 63.4% |
| Cree | 5.2 /100 | #221 | Tragic 63.3% |