Black/African American vs Immigrants from Nigeria College, Under 1 year
COMPARE
Black/African American
Immigrants from Nigeria
College, Under 1 year
College, Under 1 year Comparison
Blacks/African Americans
Immigrants from Nigeria
59.4%
COLLEGE, UNDER 1 YEAR
0.0/ 100
METRIC RATING
288th/ 347
METRIC RANK
63.7%
COLLEGE, UNDER 1 YEAR
8.8/ 100
METRIC RATING
214th/ 347
METRIC RANK
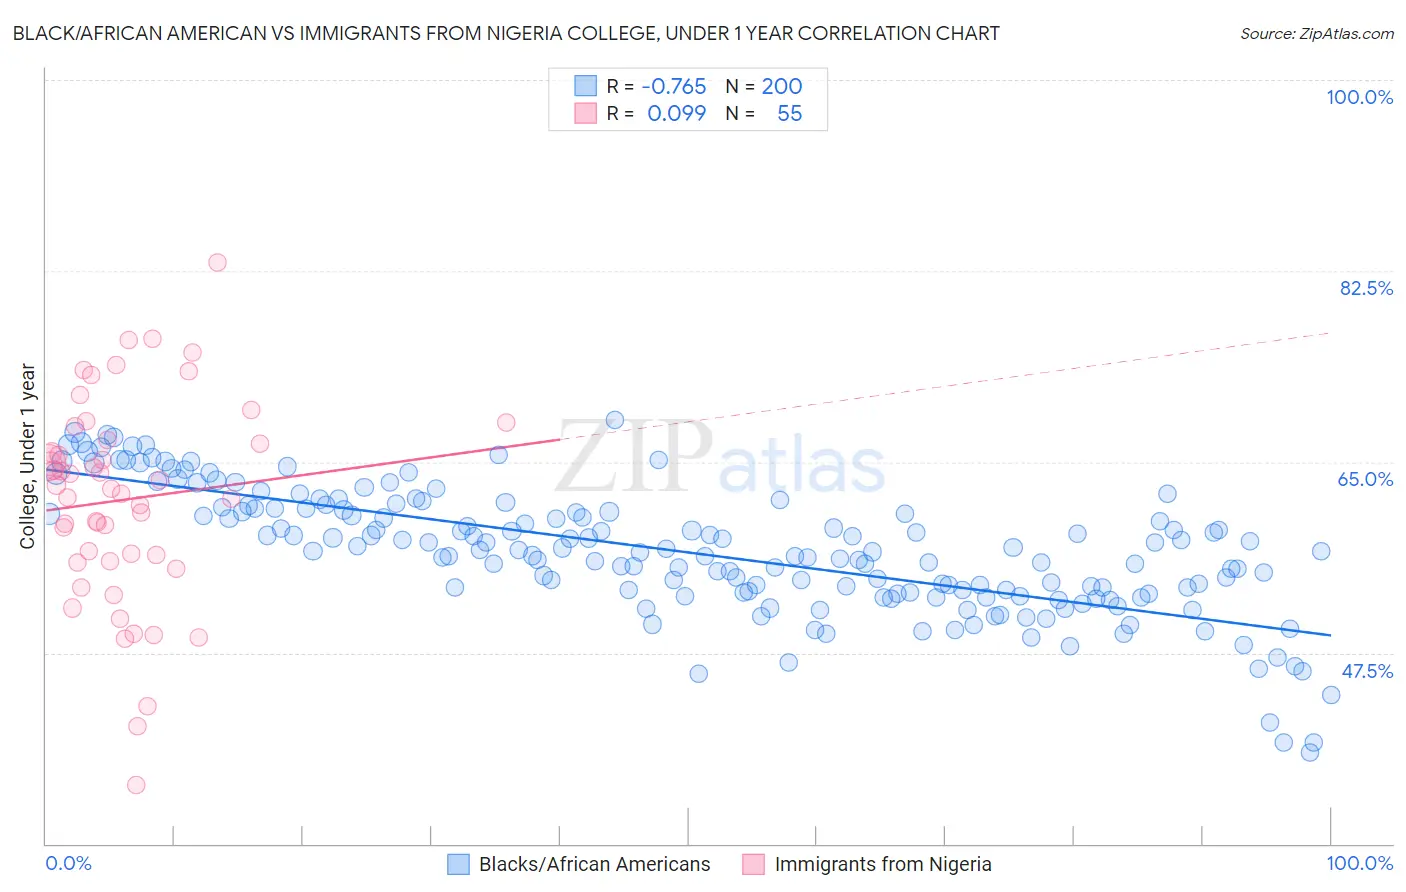
Black/African American vs Immigrants from Nigeria College, Under 1 year Correlation Chart
The statistical analysis conducted on geographies consisting of 566,038,640 people shows a strong negative correlation between the proportion of Blacks/African Americans and percentage of population with at least college, under 1 year education in the United States with a correlation coefficient (R) of -0.765 and weighted average of 59.4%. Similarly, the statistical analysis conducted on geographies consisting of 283,490,343 people shows a slight positive correlation between the proportion of Immigrants from Nigeria and percentage of population with at least college, under 1 year education in the United States with a correlation coefficient (R) of 0.099 and weighted average of 63.7%, a difference of 7.3%.
College, Under 1 year Correlation Summary
| Measurement | Black/African American | Immigrants from Nigeria |
| Minimum | 38.4% | 35.4% |
| Maximum | 68.9% | 83.3% |
| Range | 30.5% | 47.9% |
| Mean | 56.7% | 61.5% |
| Median | 56.8% | 62.6% |
| Interquartile 25% (IQ1) | 53.0% | 55.9% |
| Interquartile 75% (IQ3) | 60.7% | 67.0% |
| Interquartile Range (IQR) | 7.6% | 11.0% |
| Standard Deviation (Sample) | 5.8% | 9.4% |
| Standard Deviation (Population) | 5.7% | 9.3% |
Similar Demographics by College, Under 1 year
Demographics Similar to Blacks/African Americans by College, Under 1 year
In terms of college, under 1 year, the demographic groups most similar to Blacks/African Americans are Choctaw (59.3%, a difference of 0.070%), Sioux (59.4%, a difference of 0.10%), Ecuadorian (59.3%, a difference of 0.11%), Creek (59.3%, a difference of 0.20%), and Nicaraguan (59.2%, a difference of 0.24%).
| Demographics | Rating | Rank | College, Under 1 year |
| Cherokee | 0.1 /100 | #281 | Tragic 60.1% |
| Belizeans | 0.1 /100 | #282 | Tragic 60.1% |
| Immigrants | Jamaica | 0.0 /100 | #283 | Tragic 59.7% |
| Immigrants | St. Vincent and the Grenadines | 0.0 /100 | #284 | Tragic 59.6% |
| Paiute | 0.0 /100 | #285 | Tragic 59.6% |
| British West Indians | 0.0 /100 | #286 | Tragic 59.5% |
| Sioux | 0.0 /100 | #287 | Tragic 59.4% |
| Blacks/African Americans | 0.0 /100 | #288 | Tragic 59.4% |
| Choctaw | 0.0 /100 | #289 | Tragic 59.3% |
| Ecuadorians | 0.0 /100 | #290 | Tragic 59.3% |
| Creek | 0.0 /100 | #291 | Tragic 59.3% |
| Nicaraguans | 0.0 /100 | #292 | Tragic 59.2% |
| Seminole | 0.0 /100 | #293 | Tragic 59.1% |
| Immigrants | Belize | 0.0 /100 | #294 | Tragic 59.1% |
| Immigrants | Grenada | 0.0 /100 | #295 | Tragic 59.1% |
Demographics Similar to Immigrants from Nigeria by College, Under 1 year
In terms of college, under 1 year, the demographic groups most similar to Immigrants from Nigeria are Immigrants from South America (63.8%, a difference of 0.040%), Senegalese (63.6%, a difference of 0.17%), Immigrants from Middle Africa (63.9%, a difference of 0.22%), Native Hawaiian (63.9%, a difference of 0.23%), and Ghanaian (63.9%, a difference of 0.30%).
| Demographics | Rating | Rank | College, Under 1 year |
| Colombians | 12.4 /100 | #207 | Poor 64.0% |
| Immigrants | Vietnam | 12.1 /100 | #208 | Poor 64.0% |
| Puget Sound Salish | 11.3 /100 | #209 | Poor 63.9% |
| Ghanaians | 11.2 /100 | #210 | Poor 63.9% |
| Native Hawaiians | 10.6 /100 | #211 | Poor 63.9% |
| Immigrants | Middle Africa | 10.5 /100 | #212 | Poor 63.9% |
| Immigrants | South America | 9.1 /100 | #213 | Tragic 63.8% |
| Immigrants | Nigeria | 8.8 /100 | #214 | Tragic 63.7% |
| Senegalese | 7.7 /100 | #215 | Tragic 63.6% |
| Hmong | 6.8 /100 | #216 | Tragic 63.5% |
| Immigrants | Uruguay | 5.8 /100 | #217 | Tragic 63.4% |
| Immigrants | Panama | 5.7 /100 | #218 | Tragic 63.4% |
| Immigrants | Fiji | 5.7 /100 | #219 | Tragic 63.4% |
| Portuguese | 5.6 /100 | #220 | Tragic 63.4% |
| Cree | 5.2 /100 | #221 | Tragic 63.3% |