Nepalese vs Immigrants from Afghanistan College, Under 1 year
COMPARE
Nepalese
Immigrants from Afghanistan
College, Under 1 year
College, Under 1 year Comparison
Nepalese
Immigrants from Afghanistan
62.2%
COLLEGE, UNDER 1 YEAR
1.1/ 100
METRIC RATING
239th/ 347
METRIC RANK
66.7%
COLLEGE, UNDER 1 YEAR
85.1/ 100
METRIC RATING
141st/ 347
METRIC RANK
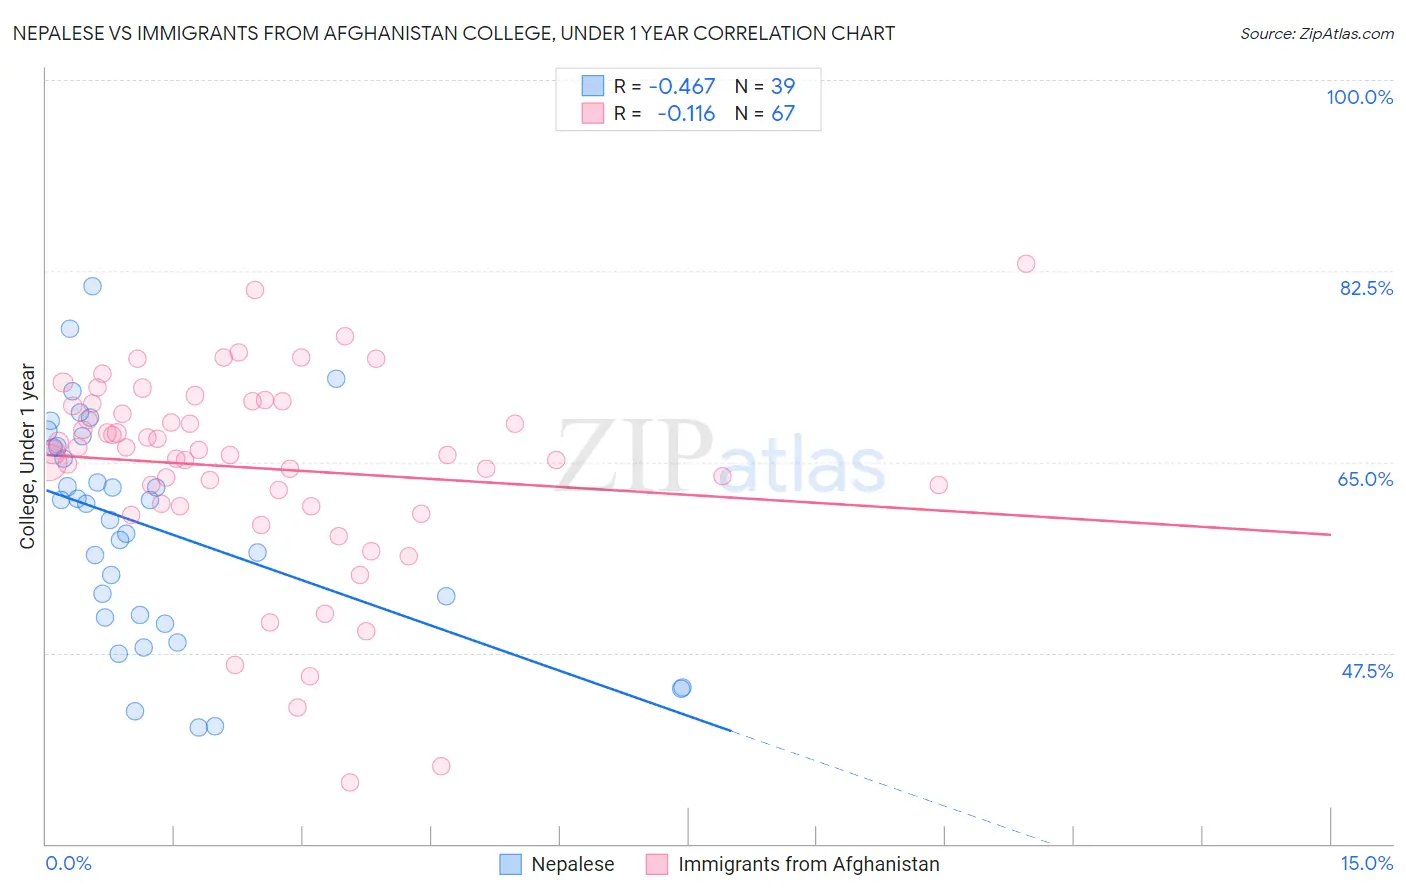
Nepalese vs Immigrants from Afghanistan College, Under 1 year Correlation Chart
The statistical analysis conducted on geographies consisting of 24,519,269 people shows a moderate negative correlation between the proportion of Nepalese and percentage of population with at least college, under 1 year education in the United States with a correlation coefficient (R) of -0.467 and weighted average of 62.2%. Similarly, the statistical analysis conducted on geographies consisting of 147,647,192 people shows a poor negative correlation between the proportion of Immigrants from Afghanistan and percentage of population with at least college, under 1 year education in the United States with a correlation coefficient (R) of -0.116 and weighted average of 66.7%, a difference of 7.2%.
College, Under 1 year Correlation Summary
| Measurement | Nepalese | Immigrants from Afghanistan |
| Minimum | 40.7% | 35.6% |
| Maximum | 81.1% | 83.1% |
| Range | 40.5% | 47.6% |
| Mean | 58.9% | 64.4% |
| Median | 61.2% | 65.9% |
| Interquartile 25% (IQ1) | 50.7% | 60.9% |
| Interquartile 75% (IQ3) | 66.4% | 70.3% |
| Interquartile Range (IQR) | 15.7% | 9.4% |
| Standard Deviation (Sample) | 10.2% | 9.3% |
| Standard Deviation (Population) | 10.0% | 9.2% |
Similar Demographics by College, Under 1 year
Demographics Similar to Nepalese by College, Under 1 year
In terms of college, under 1 year, the demographic groups most similar to Nepalese are Aleut (62.2%, a difference of 0.0%), Ottawa (62.2%, a difference of 0.010%), Malaysian (62.2%, a difference of 0.060%), Hawaiian (62.1%, a difference of 0.090%), and Colville (62.1%, a difference of 0.18%).
| Demographics | Rating | Rank | College, Under 1 year |
| Osage | 2.2 /100 | #232 | Tragic 62.7% |
| Iroquois | 2.0 /100 | #233 | Tragic 62.6% |
| Chippewa | 2.0 /100 | #234 | Tragic 62.6% |
| Spanish Americans | 1.9 /100 | #235 | Tragic 62.6% |
| Immigrants | Immigrants | 1.7 /100 | #236 | Tragic 62.5% |
| Immigrants | Burma/Myanmar | 1.6 /100 | #237 | Tragic 62.5% |
| French American Indians | 1.5 /100 | #238 | Tragic 62.4% |
| Nepalese | 1.1 /100 | #239 | Tragic 62.2% |
| Aleuts | 1.1 /100 | #240 | Tragic 62.2% |
| Ottawa | 1.1 /100 | #241 | Tragic 62.2% |
| Malaysians | 1.1 /100 | #242 | Tragic 62.2% |
| Hawaiians | 1.1 /100 | #243 | Tragic 62.1% |
| Colville | 1.0 /100 | #244 | Tragic 62.1% |
| Delaware | 0.9 /100 | #245 | Tragic 62.1% |
| Marshallese | 0.8 /100 | #246 | Tragic 61.9% |
Demographics Similar to Immigrants from Afghanistan by College, Under 1 year
In terms of college, under 1 year, the demographic groups most similar to Immigrants from Afghanistan are Venezuelan (66.7%, a difference of 0.070%), Slavic (66.7%, a difference of 0.070%), Immigrants from Italy (66.8%, a difference of 0.17%), English (66.6%, a difference of 0.18%), and Immigrants from Uganda (66.5%, a difference of 0.19%).
| Demographics | Rating | Rank | College, Under 1 year |
| Iraqis | 88.0 /100 | #134 | Excellent 66.8% |
| Canadians | 87.9 /100 | #135 | Excellent 66.8% |
| Ugandans | 87.8 /100 | #136 | Excellent 66.8% |
| Immigrants | Chile | 87.4 /100 | #137 | Excellent 66.8% |
| Immigrants | Italy | 86.9 /100 | #138 | Excellent 66.8% |
| Venezuelans | 85.9 /100 | #139 | Excellent 66.7% |
| Slavs | 85.9 /100 | #140 | Excellent 66.7% |
| Immigrants | Afghanistan | 85.1 /100 | #141 | Excellent 66.7% |
| English | 82.9 /100 | #142 | Excellent 66.6% |
| Immigrants | Uganda | 82.8 /100 | #143 | Excellent 66.5% |
| Immigrants | Germany | 82.0 /100 | #144 | Excellent 66.5% |
| Immigrants | Kenya | 81.8 /100 | #145 | Excellent 66.5% |
| Kenyans | 81.7 /100 | #146 | Excellent 66.5% |
| Immigrants | Morocco | 81.7 /100 | #147 | Excellent 66.5% |
| Taiwanese | 78.6 /100 | #148 | Good 66.4% |