Nepalese vs Immigrants from Nigeria 4th Grade
COMPARE
Nepalese
Immigrants from Nigeria
4th Grade
4th Grade Comparison
Nepalese
Immigrants from Nigeria
95.5%
4TH GRADE
0.0/ 100
METRIC RATING
338th/ 347
METRIC RANK
97.0%
4TH GRADE
0.3/ 100
METRIC RATING
267th/ 347
METRIC RANK
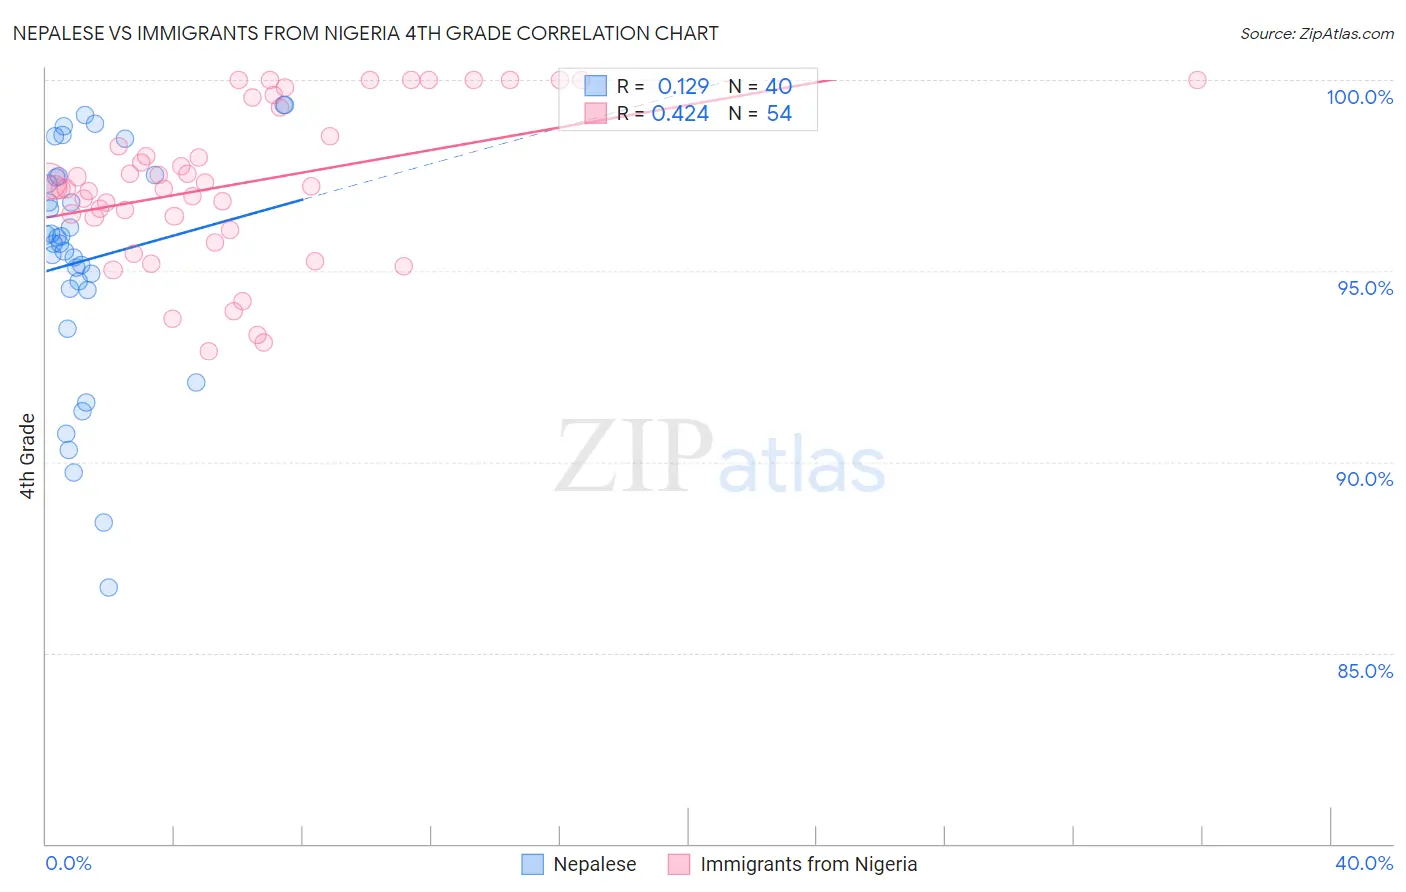
Nepalese vs Immigrants from Nigeria 4th Grade Correlation Chart
The statistical analysis conducted on geographies consisting of 24,521,755 people shows a poor positive correlation between the proportion of Nepalese and percentage of population with at least 4th grade education in the United States with a correlation coefficient (R) of 0.129 and weighted average of 95.5%. Similarly, the statistical analysis conducted on geographies consisting of 283,430,369 people shows a moderate positive correlation between the proportion of Immigrants from Nigeria and percentage of population with at least 4th grade education in the United States with a correlation coefficient (R) of 0.424 and weighted average of 97.0%, a difference of 1.6%.
4th Grade Correlation Summary
| Measurement | Nepalese | Immigrants from Nigeria |
| Minimum | 86.7% | 92.9% |
| Maximum | 99.3% | 100.0% |
| Range | 12.6% | 7.1% |
| Mean | 95.3% | 97.3% |
| Median | 95.8% | 97.2% |
| Interquartile 25% (IQ1) | 94.5% | 96.4% |
| Interquartile 75% (IQ3) | 97.5% | 99.3% |
| Interquartile Range (IQR) | 2.9% | 2.9% |
| Standard Deviation (Sample) | 3.1% | 2.0% |
| Standard Deviation (Population) | 3.1% | 2.0% |
Similar Demographics by 4th Grade
Demographics Similar to Nepalese by 4th Grade
In terms of 4th grade, the demographic groups most similar to Nepalese are Central American (95.5%, a difference of 0.0%), Mexican (95.6%, a difference of 0.13%), Immigrants from Latin America (95.7%, a difference of 0.20%), Guatemalan (95.3%, a difference of 0.20%), and Immigrants from Dominican Republic (95.7%, a difference of 0.26%).
| Demographics | Rating | Rank | 4th Grade |
| Immigrants | Armenia | 0.0 /100 | #331 | Tragic 95.8% |
| Immigrants | Honduras | 0.0 /100 | #332 | Tragic 95.8% |
| Immigrants | Dominican Republic | 0.0 /100 | #333 | Tragic 95.7% |
| Immigrants | Cabo Verde | 0.0 /100 | #334 | Tragic 95.7% |
| Immigrants | Latin America | 0.0 /100 | #335 | Tragic 95.7% |
| Mexicans | 0.0 /100 | #336 | Tragic 95.6% |
| Central Americans | 0.0 /100 | #337 | Tragic 95.5% |
| Nepalese | 0.0 /100 | #338 | Tragic 95.5% |
| Guatemalans | 0.0 /100 | #339 | Tragic 95.3% |
| Yakama | 0.0 /100 | #340 | Tragic 95.2% |
| Immigrants | Yemen | 0.0 /100 | #341 | Tragic 95.2% |
| Immigrants | Central America | 0.0 /100 | #342 | Tragic 95.1% |
| Immigrants | Guatemala | 0.0 /100 | #343 | Tragic 95.1% |
| Immigrants | Mexico | 0.0 /100 | #344 | Tragic 95.1% |
| Salvadorans | 0.0 /100 | #345 | Tragic 95.0% |
Demographics Similar to Immigrants from Nigeria by 4th Grade
In terms of 4th grade, the demographic groups most similar to Immigrants from Nigeria are Immigrants from China (97.0%, a difference of 0.0%), Taiwanese (97.0%, a difference of 0.010%), Armenian (97.0%, a difference of 0.010%), Ghanaian (97.0%, a difference of 0.010%), and Immigrants from Jamaica (97.0%, a difference of 0.020%).
| Demographics | Rating | Rank | 4th Grade |
| Immigrants | Sierra Leone | 0.4 /100 | #260 | Tragic 97.0% |
| Immigrants | South America | 0.4 /100 | #261 | Tragic 97.0% |
| West Indians | 0.4 /100 | #262 | Tragic 97.0% |
| Immigrants | Jamaica | 0.3 /100 | #263 | Tragic 97.0% |
| Taiwanese | 0.3 /100 | #264 | Tragic 97.0% |
| Armenians | 0.3 /100 | #265 | Tragic 97.0% |
| Immigrants | China | 0.3 /100 | #266 | Tragic 97.0% |
| Immigrants | Nigeria | 0.3 /100 | #267 | Tragic 97.0% |
| Ghanaians | 0.2 /100 | #268 | Tragic 97.0% |
| Immigrants | Uzbekistan | 0.2 /100 | #269 | Tragic 96.9% |
| Cubans | 0.2 /100 | #270 | Tragic 96.9% |
| Immigrants | Peru | 0.1 /100 | #271 | Tragic 96.9% |
| Fijians | 0.1 /100 | #272 | Tragic 96.9% |
| Immigrants | Cameroon | 0.1 /100 | #273 | Tragic 96.9% |
| Trinidadians and Tobagonians | 0.1 /100 | #274 | Tragic 96.9% |