Carpatho Rusyn vs Immigrants from Nigeria College, Under 1 year
COMPARE
Carpatho Rusyn
Immigrants from Nigeria
College, Under 1 year
College, Under 1 year Comparison
Carpatho Rusyns
Immigrants from Nigeria
67.9%
COLLEGE, UNDER 1 YEAR
96.8/ 100
METRIC RATING
103rd/ 347
METRIC RANK
63.7%
COLLEGE, UNDER 1 YEAR
8.8/ 100
METRIC RATING
214th/ 347
METRIC RANK
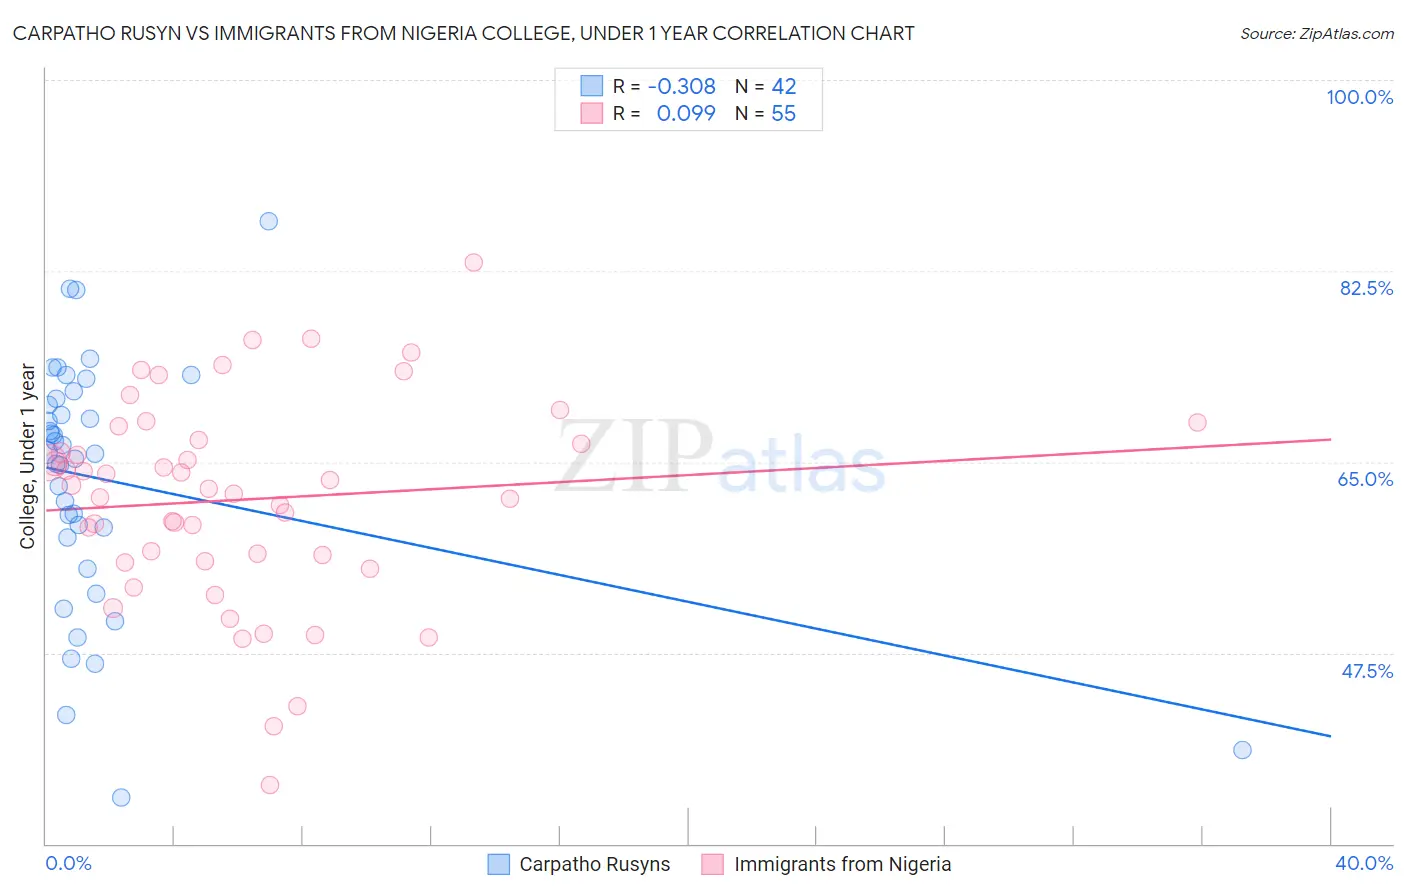
Carpatho Rusyn vs Immigrants from Nigeria College, Under 1 year Correlation Chart
The statistical analysis conducted on geographies consisting of 58,871,690 people shows a mild negative correlation between the proportion of Carpatho Rusyns and percentage of population with at least college, under 1 year education in the United States with a correlation coefficient (R) of -0.308 and weighted average of 67.9%. Similarly, the statistical analysis conducted on geographies consisting of 283,490,343 people shows a slight positive correlation between the proportion of Immigrants from Nigeria and percentage of population with at least college, under 1 year education in the United States with a correlation coefficient (R) of 0.099 and weighted average of 63.7%, a difference of 6.5%.
College, Under 1 year Correlation Summary
| Measurement | Carpatho Rusyn | Immigrants from Nigeria |
| Minimum | 34.2% | 35.4% |
| Maximum | 87.0% | 83.3% |
| Range | 52.8% | 47.9% |
| Mean | 63.3% | 61.5% |
| Median | 65.8% | 62.6% |
| Interquartile 25% (IQ1) | 58.1% | 55.9% |
| Interquartile 75% (IQ3) | 70.8% | 67.0% |
| Interquartile Range (IQR) | 12.7% | 11.0% |
| Standard Deviation (Sample) | 11.5% | 9.4% |
| Standard Deviation (Population) | 11.3% | 9.3% |
Similar Demographics by College, Under 1 year
Demographics Similar to Carpatho Rusyns by College, Under 1 year
In terms of college, under 1 year, the demographic groups most similar to Carpatho Rusyns are Immigrants from Eastern Europe (67.9%, a difference of 0.010%), Palestinian (67.9%, a difference of 0.010%), Immigrants from Argentina (67.9%, a difference of 0.060%), Immigrants from Bolivia (67.9%, a difference of 0.070%), and Immigrants from Western Asia (67.8%, a difference of 0.070%).
| Demographics | Rating | Rank | College, Under 1 year |
| Jordanians | 97.4 /100 | #96 | Exceptional 68.0% |
| Immigrants | Ethiopia | 97.3 /100 | #97 | Exceptional 68.0% |
| Paraguayans | 97.1 /100 | #98 | Exceptional 67.9% |
| Immigrants | Bolivia | 97.0 /100 | #99 | Exceptional 67.9% |
| Immigrants | Argentina | 97.0 /100 | #100 | Exceptional 67.9% |
| Immigrants | Eastern Europe | 96.9 /100 | #101 | Exceptional 67.9% |
| Palestinians | 96.9 /100 | #102 | Exceptional 67.9% |
| Carpatho Rusyns | 96.8 /100 | #103 | Exceptional 67.9% |
| Immigrants | Western Asia | 96.6 /100 | #104 | Exceptional 67.8% |
| Afghans | 96.6 /100 | #105 | Exceptional 67.8% |
| Immigrants | Croatia | 96.6 /100 | #106 | Exceptional 67.8% |
| Austrians | 96.4 /100 | #107 | Exceptional 67.8% |
| Immigrants | Egypt | 96.0 /100 | #108 | Exceptional 67.7% |
| Scandinavians | 95.8 /100 | #109 | Exceptional 67.7% |
| Assyrians/Chaldeans/Syriacs | 95.8 /100 | #110 | Exceptional 67.7% |
Demographics Similar to Immigrants from Nigeria by College, Under 1 year
In terms of college, under 1 year, the demographic groups most similar to Immigrants from Nigeria are Immigrants from South America (63.8%, a difference of 0.040%), Senegalese (63.6%, a difference of 0.17%), Immigrants from Middle Africa (63.9%, a difference of 0.22%), Native Hawaiian (63.9%, a difference of 0.23%), and Ghanaian (63.9%, a difference of 0.30%).
| Demographics | Rating | Rank | College, Under 1 year |
| Colombians | 12.4 /100 | #207 | Poor 64.0% |
| Immigrants | Vietnam | 12.1 /100 | #208 | Poor 64.0% |
| Puget Sound Salish | 11.3 /100 | #209 | Poor 63.9% |
| Ghanaians | 11.2 /100 | #210 | Poor 63.9% |
| Native Hawaiians | 10.6 /100 | #211 | Poor 63.9% |
| Immigrants | Middle Africa | 10.5 /100 | #212 | Poor 63.9% |
| Immigrants | South America | 9.1 /100 | #213 | Tragic 63.8% |
| Immigrants | Nigeria | 8.8 /100 | #214 | Tragic 63.7% |
| Senegalese | 7.7 /100 | #215 | Tragic 63.6% |
| Hmong | 6.8 /100 | #216 | Tragic 63.5% |
| Immigrants | Uruguay | 5.8 /100 | #217 | Tragic 63.4% |
| Immigrants | Panama | 5.7 /100 | #218 | Tragic 63.4% |
| Immigrants | Fiji | 5.7 /100 | #219 | Tragic 63.4% |
| Portuguese | 5.6 /100 | #220 | Tragic 63.4% |
| Cree | 5.2 /100 | #221 | Tragic 63.3% |