Nepalese vs Scottish College, Under 1 year
COMPARE
Nepalese
Scottish
College, Under 1 year
College, Under 1 year Comparison
Nepalese
Scottish
62.2%
COLLEGE, UNDER 1 YEAR
1.1/ 100
METRIC RATING
239th/ 347
METRIC RANK
67.0%
COLLEGE, UNDER 1 YEAR
90.2/ 100
METRIC RATING
128th/ 347
METRIC RANK
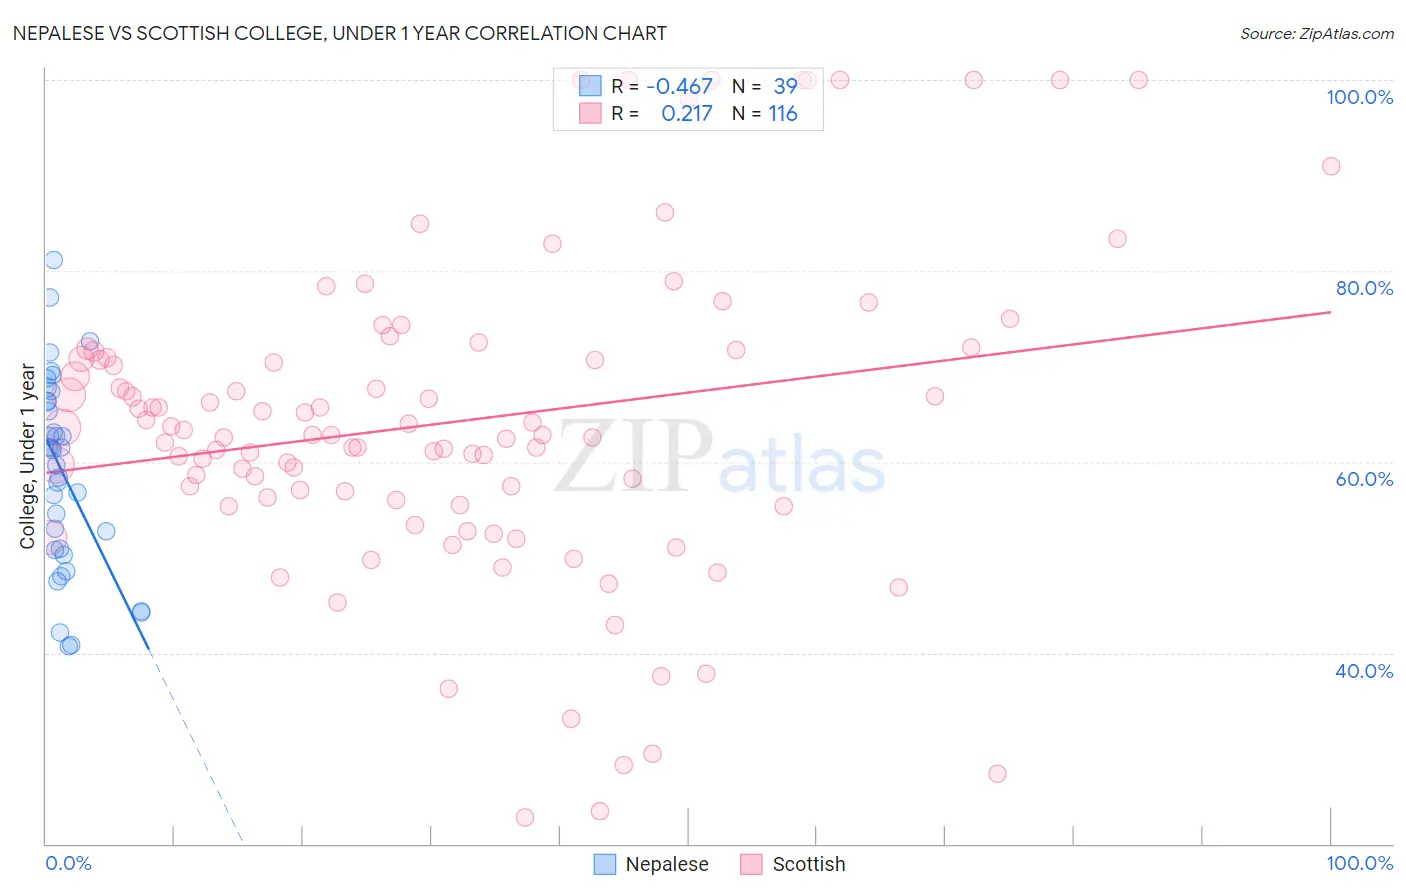
Nepalese vs Scottish College, Under 1 year Correlation Chart
The statistical analysis conducted on geographies consisting of 24,519,269 people shows a moderate negative correlation between the proportion of Nepalese and percentage of population with at least college, under 1 year education in the United States with a correlation coefficient (R) of -0.467 and weighted average of 62.2%. Similarly, the statistical analysis conducted on geographies consisting of 567,137,181 people shows a weak positive correlation between the proportion of Scottish and percentage of population with at least college, under 1 year education in the United States with a correlation coefficient (R) of 0.217 and weighted average of 67.0%, a difference of 7.7%.
College, Under 1 year Correlation Summary
| Measurement | Nepalese | Scottish |
| Minimum | 40.7% | 22.8% |
| Maximum | 81.1% | 100.0% |
| Range | 40.5% | 77.2% |
| Mean | 58.9% | 64.2% |
| Median | 61.2% | 62.8% |
| Interquartile 25% (IQ1) | 50.7% | 56.1% |
| Interquartile 75% (IQ3) | 66.4% | 71.2% |
| Interquartile Range (IQR) | 15.7% | 15.1% |
| Standard Deviation (Sample) | 10.2% | 16.6% |
| Standard Deviation (Population) | 10.0% | 16.6% |
Similar Demographics by College, Under 1 year
Demographics Similar to Nepalese by College, Under 1 year
In terms of college, under 1 year, the demographic groups most similar to Nepalese are Aleut (62.2%, a difference of 0.0%), Ottawa (62.2%, a difference of 0.010%), Malaysian (62.2%, a difference of 0.060%), Hawaiian (62.1%, a difference of 0.090%), and Colville (62.1%, a difference of 0.18%).
| Demographics | Rating | Rank | College, Under 1 year |
| Osage | 2.2 /100 | #232 | Tragic 62.7% |
| Iroquois | 2.0 /100 | #233 | Tragic 62.6% |
| Chippewa | 2.0 /100 | #234 | Tragic 62.6% |
| Spanish Americans | 1.9 /100 | #235 | Tragic 62.6% |
| Immigrants | Immigrants | 1.7 /100 | #236 | Tragic 62.5% |
| Immigrants | Burma/Myanmar | 1.6 /100 | #237 | Tragic 62.5% |
| French American Indians | 1.5 /100 | #238 | Tragic 62.4% |
| Nepalese | 1.1 /100 | #239 | Tragic 62.2% |
| Aleuts | 1.1 /100 | #240 | Tragic 62.2% |
| Ottawa | 1.1 /100 | #241 | Tragic 62.2% |
| Malaysians | 1.1 /100 | #242 | Tragic 62.2% |
| Hawaiians | 1.1 /100 | #243 | Tragic 62.1% |
| Colville | 1.0 /100 | #244 | Tragic 62.1% |
| Delaware | 0.9 /100 | #245 | Tragic 62.1% |
| Marshallese | 0.8 /100 | #246 | Tragic 61.9% |
Demographics Similar to Scottish by College, Under 1 year
In terms of college, under 1 year, the demographic groups most similar to Scottish are Czech (67.1%, a difference of 0.070%), Immigrants from Eastern Africa (67.0%, a difference of 0.080%), Alsatian (67.1%, a difference of 0.14%), Immigrants from Syria (66.9%, a difference of 0.14%), and Finnish (66.9%, a difference of 0.19%).
| Demographics | Rating | Rank | College, Under 1 year |
| Slovenes | 93.3 /100 | #121 | Exceptional 67.3% |
| Immigrants | Jordan | 92.8 /100 | #122 | Exceptional 67.3% |
| Immigrants | Northern Africa | 92.7 /100 | #123 | Exceptional 67.2% |
| Arabs | 92.6 /100 | #124 | Exceptional 67.2% |
| Italians | 91.8 /100 | #125 | Exceptional 67.2% |
| Alsatians | 91.3 /100 | #126 | Exceptional 67.1% |
| Czechs | 90.8 /100 | #127 | Exceptional 67.1% |
| Scottish | 90.2 /100 | #128 | Exceptional 67.0% |
| Immigrants | Eastern Africa | 89.5 /100 | #129 | Excellent 67.0% |
| Immigrants | Syria | 89.0 /100 | #130 | Excellent 66.9% |
| Finns | 88.6 /100 | #131 | Excellent 66.9% |
| Poles | 88.4 /100 | #132 | Excellent 66.9% |
| Immigrants | Brazil | 88.3 /100 | #133 | Excellent 66.9% |
| Iraqis | 88.0 /100 | #134 | Excellent 66.8% |
| Canadians | 87.9 /100 | #135 | Excellent 66.8% |