Navajo vs Immigrants from France 9th Grade
COMPARE
Navajo
Immigrants from France
9th Grade
9th Grade Comparison
Navajo
Immigrants from France
93.9%
9TH GRADE
0.3/ 100
METRIC RATING
266th/ 347
METRIC RANK
95.5%
9TH GRADE
97.4/ 100
METRIC RATING
105th/ 347
METRIC RANK
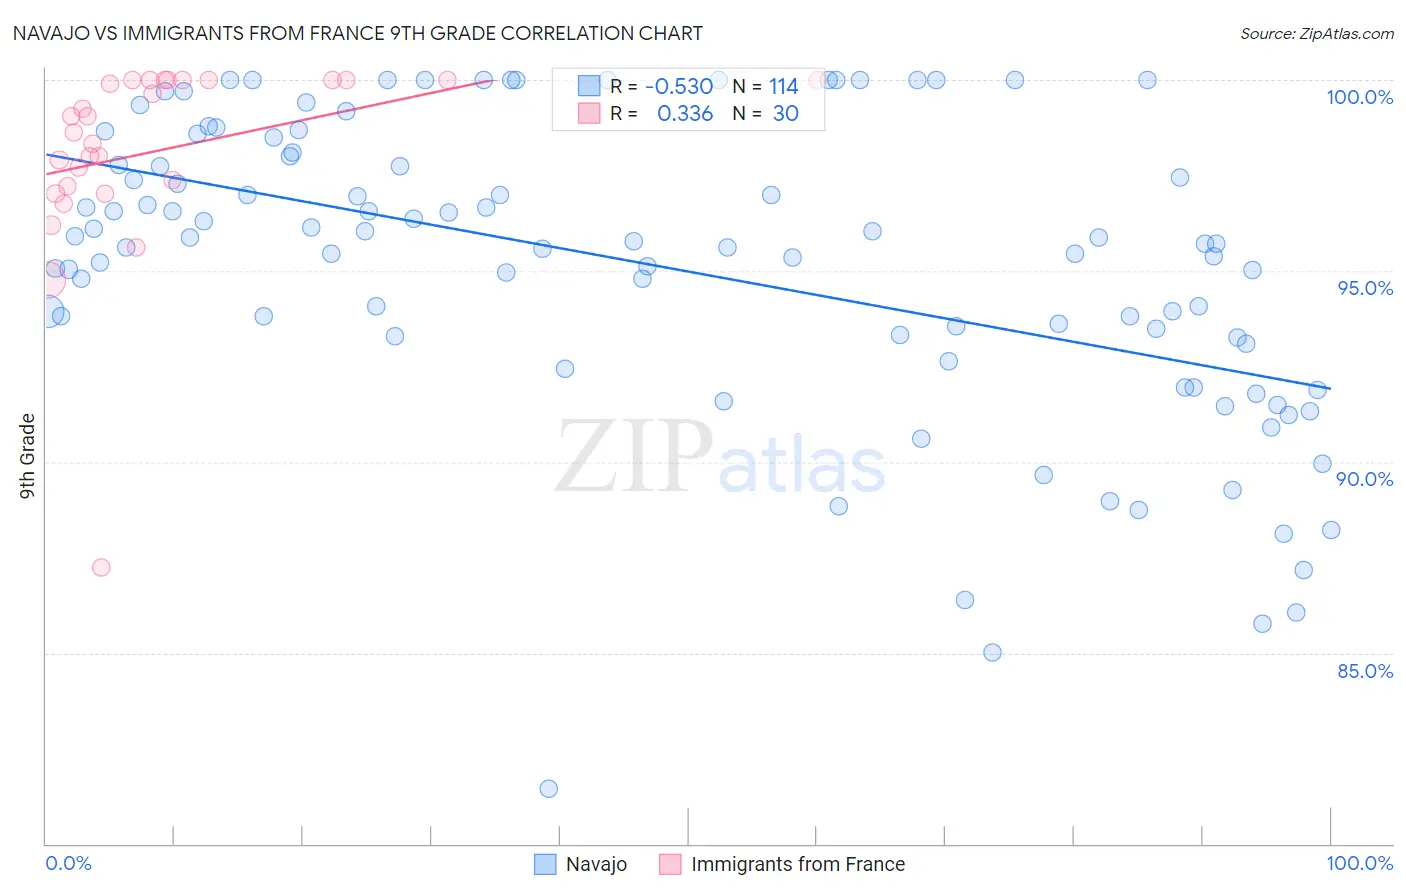
Navajo vs Immigrants from France 9th Grade Correlation Chart
The statistical analysis conducted on geographies consisting of 224,872,587 people shows a substantial negative correlation between the proportion of Navajo and percentage of population with at least 9th grade education in the United States with a correlation coefficient (R) of -0.530 and weighted average of 93.9%. Similarly, the statistical analysis conducted on geographies consisting of 287,920,814 people shows a mild positive correlation between the proportion of Immigrants from France and percentage of population with at least 9th grade education in the United States with a correlation coefficient (R) of 0.336 and weighted average of 95.5%, a difference of 1.7%.
9th Grade Correlation Summary
| Measurement | Navajo | Immigrants from France |
| Minimum | 81.4% | 87.2% |
| Maximum | 100.0% | 100.0% |
| Range | 18.6% | 12.8% |
| Mean | 95.1% | 98.2% |
| Median | 95.7% | 98.8% |
| Interquartile 25% (IQ1) | 93.2% | 97.2% |
| Interquartile 75% (IQ3) | 98.0% | 100.0% |
| Interquartile Range (IQR) | 4.8% | 2.8% |
| Standard Deviation (Sample) | 3.9% | 2.6% |
| Standard Deviation (Population) | 3.9% | 2.5% |
Similar Demographics by 9th Grade
Demographics Similar to Navajo by 9th Grade
In terms of 9th grade, the demographic groups most similar to Navajo are Immigrants from Congo (93.9%, a difference of 0.010%), Native/Alaskan (93.9%, a difference of 0.010%), Immigrants from Jamaica (93.9%, a difference of 0.020%), Immigrants from Uzbekistan (93.9%, a difference of 0.020%), and Armenian (93.9%, a difference of 0.020%).
| Demographics | Rating | Rank | 9th Grade |
| Ghanaians | 0.5 /100 | #259 | Tragic 93.9% |
| Pima | 0.4 /100 | #260 | Tragic 93.9% |
| South Americans | 0.4 /100 | #261 | Tragic 93.9% |
| Immigrants | Jamaica | 0.4 /100 | #262 | Tragic 93.9% |
| Immigrants | Uzbekistan | 0.4 /100 | #263 | Tragic 93.9% |
| Immigrants | Congo | 0.4 /100 | #264 | Tragic 93.9% |
| Natives/Alaskans | 0.4 /100 | #265 | Tragic 93.9% |
| Navajo | 0.3 /100 | #266 | Tragic 93.9% |
| Armenians | 0.3 /100 | #267 | Tragic 93.9% |
| Immigrants | Bolivia | 0.3 /100 | #268 | Tragic 93.9% |
| Immigrants | Uruguay | 0.2 /100 | #269 | Tragic 93.8% |
| Yuman | 0.2 /100 | #270 | Tragic 93.8% |
| Immigrants | Ghana | 0.2 /100 | #271 | Tragic 93.8% |
| Immigrants | Western Africa | 0.2 /100 | #272 | Tragic 93.8% |
| Immigrants | South America | 0.2 /100 | #273 | Tragic 93.8% |
Demographics Similar to Immigrants from France by 9th Grade
In terms of 9th grade, the demographic groups most similar to Immigrants from France are Syrian (95.5%, a difference of 0.0%), Immigrants from Norway (95.5%, a difference of 0.010%), Potawatomi (95.5%, a difference of 0.020%), Immigrants from Switzerland (95.5%, a difference of 0.030%), and Immigrants from Zimbabwe (95.5%, a difference of 0.030%).
| Demographics | Rating | Rank | 9th Grade |
| Immigrants | Japan | 98.4 /100 | #98 | Exceptional 95.6% |
| Menominee | 98.3 /100 | #99 | Exceptional 95.6% |
| Lebanese | 98.1 /100 | #100 | Exceptional 95.6% |
| Immigrants | Moldova | 97.9 /100 | #101 | Exceptional 95.5% |
| Immigrants | Switzerland | 97.7 /100 | #102 | Exceptional 95.5% |
| Potawatomi | 97.7 /100 | #103 | Exceptional 95.5% |
| Syrians | 97.4 /100 | #104 | Exceptional 95.5% |
| Immigrants | France | 97.4 /100 | #105 | Exceptional 95.5% |
| Immigrants | Norway | 97.1 /100 | #106 | Exceptional 95.5% |
| Immigrants | Zimbabwe | 96.9 /100 | #107 | Exceptional 95.5% |
| Chickasaw | 96.8 /100 | #108 | Exceptional 95.5% |
| Osage | 96.8 /100 | #109 | Exceptional 95.5% |
| Immigrants | Bulgaria | 96.7 /100 | #110 | Exceptional 95.5% |
| Cherokee | 96.3 /100 | #111 | Exceptional 95.4% |
| Immigrants | Croatia | 96.2 /100 | #112 | Exceptional 95.4% |