Navajo vs Bolivian 9th Grade
COMPARE
Navajo
Bolivian
9th Grade
9th Grade Comparison
Navajo
Bolivians
93.9%
9TH GRADE
0.3/ 100
METRIC RATING
266th/ 347
METRIC RANK
94.3%
9TH GRADE
3.3/ 100
METRIC RATING
235th/ 347
METRIC RANK
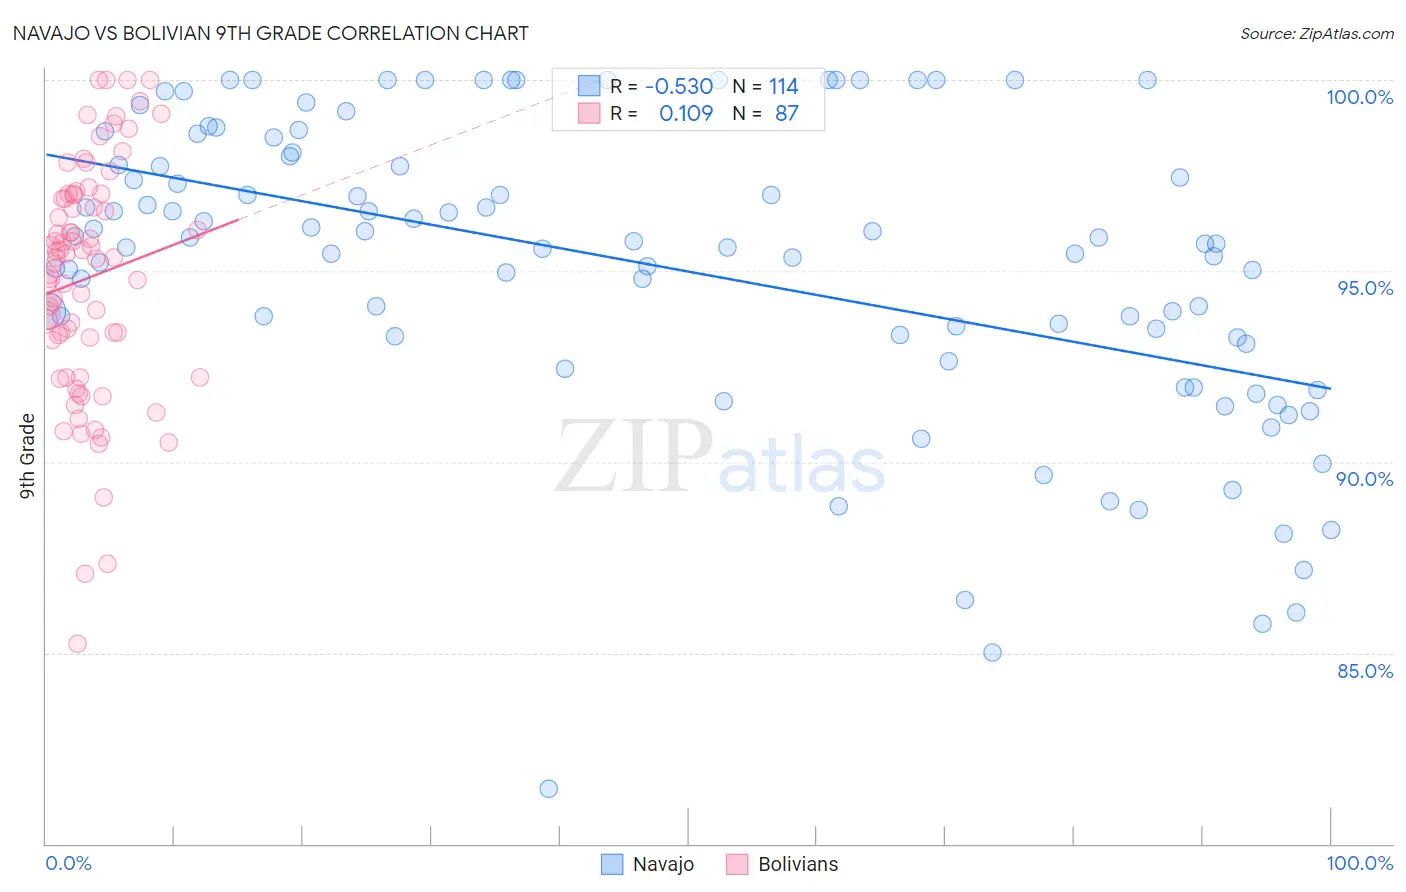
Navajo vs Bolivian 9th Grade Correlation Chart
The statistical analysis conducted on geographies consisting of 224,872,587 people shows a substantial negative correlation between the proportion of Navajo and percentage of population with at least 9th grade education in the United States with a correlation coefficient (R) of -0.530 and weighted average of 93.9%. Similarly, the statistical analysis conducted on geographies consisting of 184,666,822 people shows a poor positive correlation between the proportion of Bolivians and percentage of population with at least 9th grade education in the United States with a correlation coefficient (R) of 0.109 and weighted average of 94.3%, a difference of 0.42%.
9th Grade Correlation Summary
| Measurement | Navajo | Bolivian |
| Minimum | 81.4% | 85.2% |
| Maximum | 100.0% | 100.0% |
| Range | 18.6% | 14.8% |
| Mean | 95.1% | 94.8% |
| Median | 95.7% | 95.3% |
| Interquartile 25% (IQ1) | 93.2% | 93.2% |
| Interquartile 75% (IQ3) | 98.0% | 97.0% |
| Interquartile Range (IQR) | 4.8% | 3.8% |
| Standard Deviation (Sample) | 3.9% | 3.1% |
| Standard Deviation (Population) | 3.9% | 3.0% |
Similar Demographics by 9th Grade
Demographics Similar to Navajo by 9th Grade
In terms of 9th grade, the demographic groups most similar to Navajo are Immigrants from Congo (93.9%, a difference of 0.010%), Native/Alaskan (93.9%, a difference of 0.010%), Immigrants from Jamaica (93.9%, a difference of 0.020%), Immigrants from Uzbekistan (93.9%, a difference of 0.020%), and Armenian (93.9%, a difference of 0.020%).
| Demographics | Rating | Rank | 9th Grade |
| Ghanaians | 0.5 /100 | #259 | Tragic 93.9% |
| Pima | 0.4 /100 | #260 | Tragic 93.9% |
| South Americans | 0.4 /100 | #261 | Tragic 93.9% |
| Immigrants | Jamaica | 0.4 /100 | #262 | Tragic 93.9% |
| Immigrants | Uzbekistan | 0.4 /100 | #263 | Tragic 93.9% |
| Immigrants | Congo | 0.4 /100 | #264 | Tragic 93.9% |
| Natives/Alaskans | 0.4 /100 | #265 | Tragic 93.9% |
| Navajo | 0.3 /100 | #266 | Tragic 93.9% |
| Armenians | 0.3 /100 | #267 | Tragic 93.9% |
| Immigrants | Bolivia | 0.3 /100 | #268 | Tragic 93.9% |
| Immigrants | Uruguay | 0.2 /100 | #269 | Tragic 93.8% |
| Yuman | 0.2 /100 | #270 | Tragic 93.8% |
| Immigrants | Ghana | 0.2 /100 | #271 | Tragic 93.8% |
| Immigrants | Western Africa | 0.2 /100 | #272 | Tragic 93.8% |
| Immigrants | South America | 0.2 /100 | #273 | Tragic 93.8% |
Demographics Similar to Bolivians by 9th Grade
In terms of 9th grade, the demographic groups most similar to Bolivians are Costa Rican (94.3%, a difference of 0.010%), Nigerian (94.3%, a difference of 0.020%), Somali (94.3%, a difference of 0.020%), Immigrants from Africa (94.3%, a difference of 0.030%), and Korean (94.3%, a difference of 0.030%).
| Demographics | Rating | Rank | 9th Grade |
| Lumbee | 4.7 /100 | #228 | Tragic 94.4% |
| Immigrants | Southern Europe | 4.5 /100 | #229 | Tragic 94.3% |
| Apache | 4.2 /100 | #230 | Tragic 94.3% |
| Immigrants | Panama | 4.0 /100 | #231 | Tragic 94.3% |
| Immigrants | Africa | 3.9 /100 | #232 | Tragic 94.3% |
| Nigerians | 3.7 /100 | #233 | Tragic 94.3% |
| Costa Ricans | 3.5 /100 | #234 | Tragic 94.3% |
| Bolivians | 3.3 /100 | #235 | Tragic 94.3% |
| Somalis | 2.9 /100 | #236 | Tragic 94.3% |
| Koreans | 2.9 /100 | #237 | Tragic 94.3% |
| South American Indians | 2.8 /100 | #238 | Tragic 94.3% |
| Immigrants | China | 2.8 /100 | #239 | Tragic 94.3% |
| Immigrants | Ethiopia | 2.7 /100 | #240 | Tragic 94.3% |
| Spanish Americans | 2.6 /100 | #241 | Tragic 94.2% |
| Immigrants | Middle Africa | 2.2 /100 | #242 | Tragic 94.2% |