Yaqui vs Immigrants from Hong Kong 9th Grade
COMPARE
Yaqui
Immigrants from Hong Kong
9th Grade
9th Grade Comparison
Yaqui
Immigrants from Hong Kong
92.9%
9TH GRADE
0.0/ 100
METRIC RATING
300th/ 347
METRIC RANK
94.1%
9TH GRADE
1.3/ 100
METRIC RATING
250th/ 347
METRIC RANK
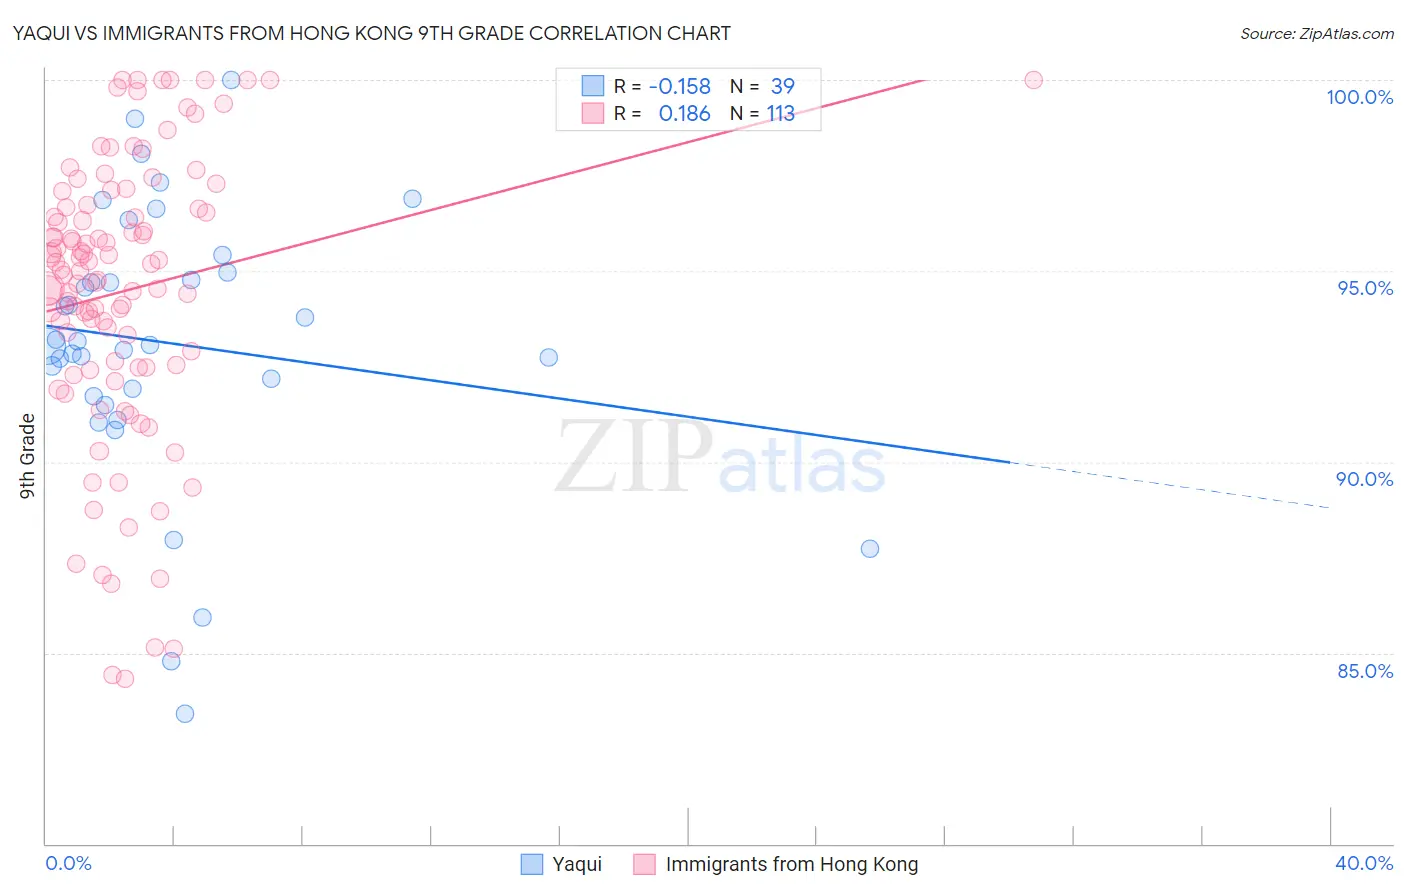
Yaqui vs Immigrants from Hong Kong 9th Grade Correlation Chart
The statistical analysis conducted on geographies consisting of 107,725,021 people shows a poor negative correlation between the proportion of Yaqui and percentage of population with at least 9th grade education in the United States with a correlation coefficient (R) of -0.158 and weighted average of 92.9%. Similarly, the statistical analysis conducted on geographies consisting of 253,990,382 people shows a poor positive correlation between the proportion of Immigrants from Hong Kong and percentage of population with at least 9th grade education in the United States with a correlation coefficient (R) of 0.186 and weighted average of 94.1%, a difference of 1.3%.
9th Grade Correlation Summary
| Measurement | Yaqui | Immigrants from Hong Kong |
| Minimum | 83.4% | 84.3% |
| Maximum | 100.0% | 100.0% |
| Range | 16.6% | 15.7% |
| Mean | 93.1% | 94.5% |
| Median | 93.1% | 95.0% |
| Interquartile 25% (IQ1) | 91.7% | 92.5% |
| Interquartile 75% (IQ3) | 94.9% | 96.7% |
| Interquartile Range (IQR) | 3.2% | 4.2% |
| Standard Deviation (Sample) | 3.6% | 3.7% |
| Standard Deviation (Population) | 3.5% | 3.7% |
Similar Demographics by 9th Grade
Demographics Similar to Yaqui by 9th Grade
In terms of 9th grade, the demographic groups most similar to Yaqui are Immigrants from Grenada (93.0%, a difference of 0.13%), Immigrants from Haiti (92.7%, a difference of 0.17%), Haitian (93.1%, a difference of 0.20%), Fijian (93.1%, a difference of 0.22%), and Immigrants from Dominica (92.7%, a difference of 0.25%).
| Demographics | Rating | Rank | 9th Grade |
| Sri Lankans | 0.0 /100 | #293 | Tragic 93.2% |
| Cubans | 0.0 /100 | #294 | Tragic 93.2% |
| Immigrants | Burma/Myanmar | 0.0 /100 | #295 | Tragic 93.1% |
| Indonesians | 0.0 /100 | #296 | Tragic 93.1% |
| Fijians | 0.0 /100 | #297 | Tragic 93.1% |
| Haitians | 0.0 /100 | #298 | Tragic 93.1% |
| Immigrants | Grenada | 0.0 /100 | #299 | Tragic 93.0% |
| Yaqui | 0.0 /100 | #300 | Tragic 92.9% |
| Immigrants | Haiti | 0.0 /100 | #301 | Tragic 92.7% |
| Immigrants | Dominica | 0.0 /100 | #302 | Tragic 92.7% |
| Guyanese | 0.0 /100 | #303 | Tragic 92.7% |
| Tohono O'odham | 0.0 /100 | #304 | Tragic 92.6% |
| Japanese | 0.0 /100 | #305 | Tragic 92.6% |
| Immigrants | Vietnam | 0.0 /100 | #306 | Tragic 92.6% |
| Immigrants | Immigrants | 0.0 /100 | #307 | Tragic 92.5% |
Demographics Similar to Immigrants from Hong Kong by 9th Grade
In terms of 9th grade, the demographic groups most similar to Immigrants from Hong Kong are Uruguayan (94.1%, a difference of 0.0%), Immigrants from Somalia (94.1%, a difference of 0.010%), Afghan (94.2%, a difference of 0.060%), Jamaican (94.1%, a difference of 0.060%), and Immigrants from Senegal (94.1%, a difference of 0.060%).
| Demographics | Rating | Rank | 9th Grade |
| Immigrants | Cameroon | 2.1 /100 | #243 | Tragic 94.2% |
| Dutch West Indians | 2.0 /100 | #244 | Tragic 94.2% |
| Paiute | 1.9 /100 | #245 | Tragic 94.2% |
| Senegalese | 1.9 /100 | #246 | Tragic 94.2% |
| Afghans | 1.8 /100 | #247 | Tragic 94.2% |
| Immigrants | Somalia | 1.4 /100 | #248 | Tragic 94.1% |
| Uruguayans | 1.3 /100 | #249 | Tragic 94.1% |
| Immigrants | Hong Kong | 1.3 /100 | #250 | Tragic 94.1% |
| Jamaicans | 1.0 /100 | #251 | Tragic 94.1% |
| Immigrants | Senegal | 0.9 /100 | #252 | Tragic 94.1% |
| Colombians | 0.8 /100 | #253 | Tragic 94.0% |
| U.S. Virgin Islanders | 0.7 /100 | #254 | Tragic 94.0% |
| Immigrants | Nigeria | 0.6 /100 | #255 | Tragic 94.0% |
| Immigrants | Afghanistan | 0.5 /100 | #256 | Tragic 94.0% |
| Immigrants | Costa Rica | 0.5 /100 | #257 | Tragic 94.0% |